The web is a hostile place and our JavaScript apps will inevitably break. Browser changes, invasive plugins, unstable networks, or just plain bugs—something is going to go wrong. When it does, we need to be ready. We need to know what went wrong and how to fix it or our users just won’t come back.
I wrote up this summary of how to get started monitoring errors in your app, and how to think through debugging the most common bugs you’ll encounter. Let’s get started.
Logging Our First JavaScript Error
To log and record errors from our application, you’ll need to add listeners to your application for errors. Unfortunately, there’s several ways that web applications can break, each needs its own listener.
First, we can attach to the global error handler, and send errors back to your logs:
window.addEventListener("error", (error) => {
  fetch("/your/error/log", {
    method: "POST",
    headers: {
      "Content-Type": "application/json",
    },
    body: JSON.stringify({
      message: error.message,
      stack: error.stack
    })
  })
})
But that won’t catch unhandled promise rejections, which blow up in an async way. So we have to listen for those separately:
window.addEventListener("unhandledrejection", (reason) => {
  fetch("/your/error/log", {
    method: "POST",
    headers: {
      "Content-Type": "application/json",
    },
    // Reasons can be anything, so you'll want to normalize this somehow.
    body: JSON.stringify(reason)
  })
})
You might always want to listen for failing fetch calls, or messages printed to console.error. There’s a lot of other things to handle as well, such as deduplication, throttling, and getting additional context.
The Easy Way with TrackJS
If you don’t want to roll this all yourself, tools like TrackJS Error Monitoring can help! If you haven’t already, grab a free trial account of JavaScript Error Monitoring from TrackJS and it will show you a installation snippet that looks something like this:
<script src="https://cdn.trackjs.com/agent/v3/latest/t.js"></script>
<script>
  window.TrackJS && TrackJS.install({
    token: "YOUR_TRACKJS_TOKEN"
    // for more configuration options, see https://docs.trackjs.com
  });
</script>
The agent will capture errors from window, promises, callbacks, console, network requests, and more!
This doesn’t have to be in the <head>, but it should probably be the first script on the page. Otherwise, any errors that happen before we can capture it would never get reported! There is also an npm package so that you could bundle the script with the rest of your app.
Testing it out
Now that we’re listening to our app for errors, let’s make sure it’s working. Open up your browser console and try this:
setTimeout(function() { undef(); });
You should see an error being sent off in the browser Network tab, and if you’re using TrackJS it should show in your Recent error list.

You may be wondering why we needed setTimeout. Most browser consoles create a sandbox to prevent errors from leaking into the document. However, in this case, that’s exactly what we’re trying to do! The setTimeout allows us to inject our error into the document to be executed on the next event cycle.
The Shape of a JavaScript Error
Now that we are capturing errors, let’s have a look at them. There are several categories of JavaScript errors, like TypeError, ReferenceError, and SyntaxError, but they all share some basic structure:
interface Error {
  name: string;    // Usually the category of the error, like `TypeError`
  message: string; // The error message
}
Wait, what about the stack? Strangely enough, the stack trace is a non-standard property! Internet Explorer older than 10 and Safari older than 6 do not even include it. Even in new browsers, the structure and syntax of the stack trace is different. TrackJS will automatically normalize the structure of your stack traces.
Monitoring Network Errors
Not all web errors involve the JavaScript Error object. Most apps chat with a server and sometimes that communication breaks. Tracking network errors are an important part of understanding the end user experience.
Unfortunately, there is not a standard way to describe a network error. TrackJS records network errors as the method and URL of the network request, as well as the status code of the response. To protect sensitive data, it does not capture request or response bodies or headers. If you are customizing your own tools, you may want to consider capturing this depending on the context of your application.
Since TrackJS records messages passed into the console, you could add your own request and response bodies and headers by writing them out to console.log during send.
Logging Browser Console Errors
Many third-party JavaScript libraries reveal errors and configuration problems as console.error messages. While I don’t agree with mechanism of revealing errors, this is a common enough practice that we should know when it happens.
TrackJS will automatically record messages passed into console.error. Recording the console is not difficult, and there are many uses for doing this:
var originalFunction = console.error;
console.error = function() {
  var args = Array.prototype.slice.call(arguments);

  // SaveOrEnhanceTheConsoleArgs(args);

  return originalFunction.apply(console, args);
}
You can try more ways to intercept native functions by wrapping JavaScript functions
Understanding the Context of a JavaScript Error
Even when you have an error recorded, it can be difficult to understand what exactly happened or how to reproduce it. Browser apps are a infinitely complex state machine-with the interactions between asynchronous JavaScript, browser implementations, user extensions, and flaky networks.
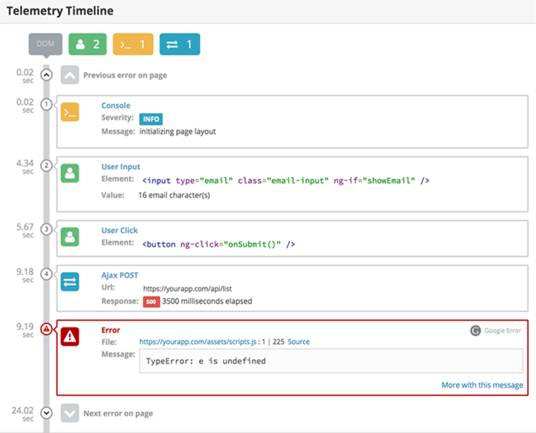
You’ll need to have some insight into the state of things when an error happens, like what browser is running, the URL the user is on, and the version of your app. There will probably be dozens of other variables for your context that you’ll want to capture. TrackJS records tons of this context automatically, and gives you a powerful hook to define your own custom metadata about your application state. But what is really interesting is the Telemetry Timeline.

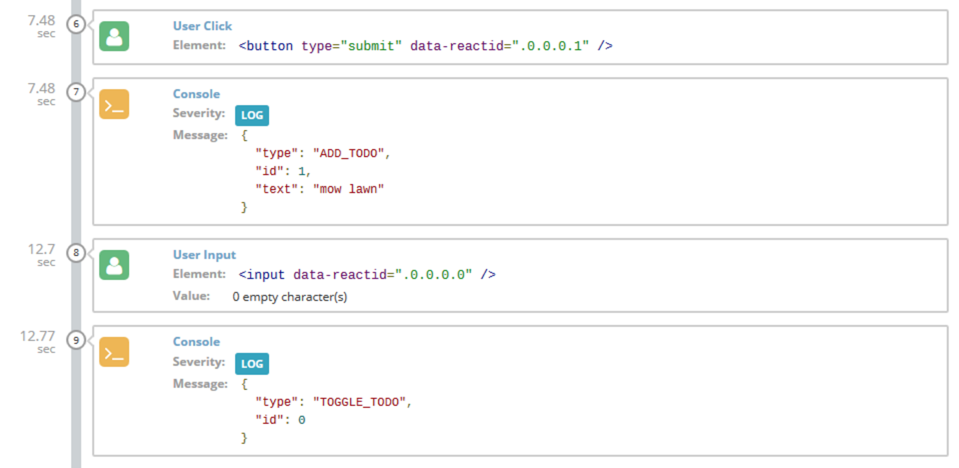
Telemetry is all the things that your application is doing before an error happens. Things like changing state, issuing network requests, or responding to user actions. The TrackJS agent is recording this telemetry all the time so that it can be included when an error happens. It’s a really great way to visualize how an error occurred, especially when you’re debugging code you didn’t write.
If you are using an framework like Redux, this can be a really powerful way to visualize state transitions.

Dealing with “Script Error”
One of the first errors you are likely to log is Script Error. This is caused by the browser obfuscating errors from a script on a different origin as part of the Same-Origin Policy. For example, if your scripts are loaded from a CDN, or referenced from a third-party, errors that originate in them would have their details stripped out.
Script Error Sucks. There is no context. No clues. No indication of how your users are impacted. We need to get it out of the way fast to understand our real problems.
The most compatible way to handle Script Error is to load scripts from the same origin as the page. You may lose some performance benefits of a CDN and multiplexed loading, so may want to consider doing this temporarily or for only a fraction of your traffic. For example, you could have 10% of your traffic load scripts from the same origin and use this traffic for error monitoring.
For a more thorough discussion and the causes and other solutions, check out our analysis of Script Error.
Identifying and Fixing JavaScript Errors
Once we have good contextual errors being reported, we need to actually fix them. Yep, now the hard work begins. It’s up to you to sift through the errors with your unique understanding of your application, your users, and your context.
I often start by trying to find the general cause of an error first, as it helps narrow the debugging. Here are some general causes of errors and some clues you can look for in your error data to identify them.
1. Browser Compatibility Errors
The application does not work correctly in a set of browsers. Perhaps there is an expectation of an interface or behavior that does not exist, or the browser has unexpected performance characteristics.
Symptoms: Low cardinality of browsers affected. If there is a small number of browser reporting the error, and you have not specifically tested the application with the browsers.
Debug With: Use developer tooling provided by the browser reporting errors to debug compatibility. If the browser does not provide developer tooling, you can always fallback to console and alert.
2. User Configuration Error
The user has customized their network or browser environment in ways that are incompatible with the application. This could include invasive browser extensions that manipulate the document, or network proxies that re-write content during transmission.
Symptoms: Errors originate from unrecognizable sources not part of your original application.
Debug With: Expand your error context to record the contents of the document and scripts as part of error capture. Compare these with the expected application to determine if they have been manipulated.
3. Network Resilience Errors
The application fails when certain kinds of network failures have occurred. The internet is not always reliable, especially over mobile networks, applications can fail in interesting ways when some or all of the assets of the page fail to load.
At the 2016 Google I/O conference, Ilya Grigorik shared metrics that 1%-10% of network requests may fail from a mobile device due to connectivity or processing constraints.
Symptoms: Reports of TypeError and ReferenceError reports that foundational interfaces are not available. For example $ is not defined. These can arise if the scripts that provide these foundations fail to load.
Debug With: Check the load and presence of assets with error reports. Explore how your application loads if key assets are removed. If possible, construct reasonable fallbacks and safety check for types before using them. Progressive Enhancement is still the best path.
4. Integration Errors
The nature of web applications mandate that many integrations happen at runtime in the browser. These integrations can fail when one of the parties change an interface. This could occur if you are calling a third-party HTTP API (like Firebase) or interacting with a third-party JavaScript library (like Stripe).
Symptoms: Errors that begin reporting as of a specific date and time that does not correspond to your own release schedule. When integrating with third parties, note that their changes can impact the experiences of your customers.
Debug With: This should be debuggable with standard developer tools, like the Chrome Developer Tools.
5. Logical Applications Errors
When we run out of everything else to blame, it must be our own code. The timing of real-world asynchronous events or edge cases of the application state may not be accounted for.
Symptoms: Various
Debug: Record customized context about your application to better understand the current state and timing.
Building Better Web Applications with Monitoring
JavaScript Happens, and we need to be ready for it.
It’s amazing how much better our apps can be with a little feedback from our production environments. Usually there are only a handful of subtle problems keeping applications from being great. I’d love to help make yours great and crush a few bugs. Grab a free 14 days of TrackJS and let’s build a better web.


