
TrackJS gives your team visibility into how websites behave in production and the tools to understand bugs quickly. You can track your error rate over time and measure your progress. But how does your site quality compared to everyone else?
Announcing a new kind of notification from TrackJS, the Weekly Site Quality Benchmark.
We found that many front-end teams don’t understand whether their current error rate is good or bad. If you have 1 error for every 12 page views, is that good? We built this site quality report to answer that.
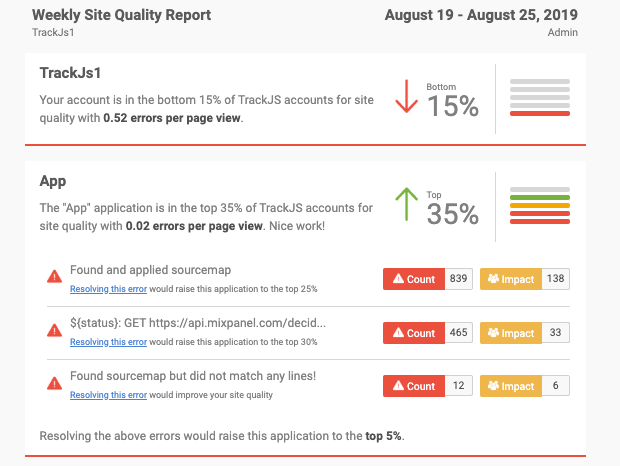
This weekly report is for development managers and front-end team leads to understand the site quality of their websites, and how that compares with industry averages. Understanding how you rank against others can drive investing time to fix more bugs.
It also shows you the errors that are holding you back with a wizard to help you take action.
The weekly email is available now in your TrackJS account. Subscribe to it from your notifications settings.
