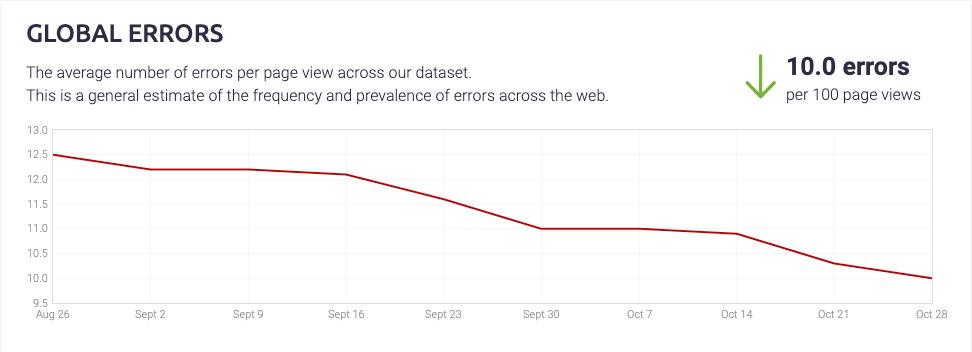
Today, we’re releasing TrackJS Global Error Statistics to the public. This aggregated production data is a useful measure of the state of client-side JavaScript errors and the quality of the web. We break it down by the most common errors, browsers, and operating systems.
We did this a few years ago with the State of Client-Side JavaScript Errors. It was quite useful, but very time consuming to produce. We haven’t had time to do it again since 2015, with all the other things we’ve been building.
But this time is different. We built the reports to calculate everything automatically. Our system calculates aggregate metrics and publishes them every week, and the error statistics report parses out some numbers.

We’ve been aggregating data since early September, so we don’t have a lot of history yet. But as we gather more, the report will become more useful. When you feel like the web is getting buggier, we’ll have objective data for you to reference.
The report also pulls data on the most common errors. I review that data and write summaries about the error, and why they happen. No surprise, the #1 error continues to be Script Error.
As patterns develop in the report, we’ll be writing a lot more about the global error data and what it means. If there is something you’d like to see, please let us know!.


