

We store all of our JavaScript error data in a large Elasticsearch cluster. This lets our customers slice and dice their error data in realtime, and perform full text searches over it. We push Elasticsearch to its limit, and we recently started querying more data for some of our core pages. We noticed that a certain set of our customers started experiencing unacceptably slow page response times. This is how we tracked down the problem and fixed it.
Aggregations: GROUPBY in Elasticsearch
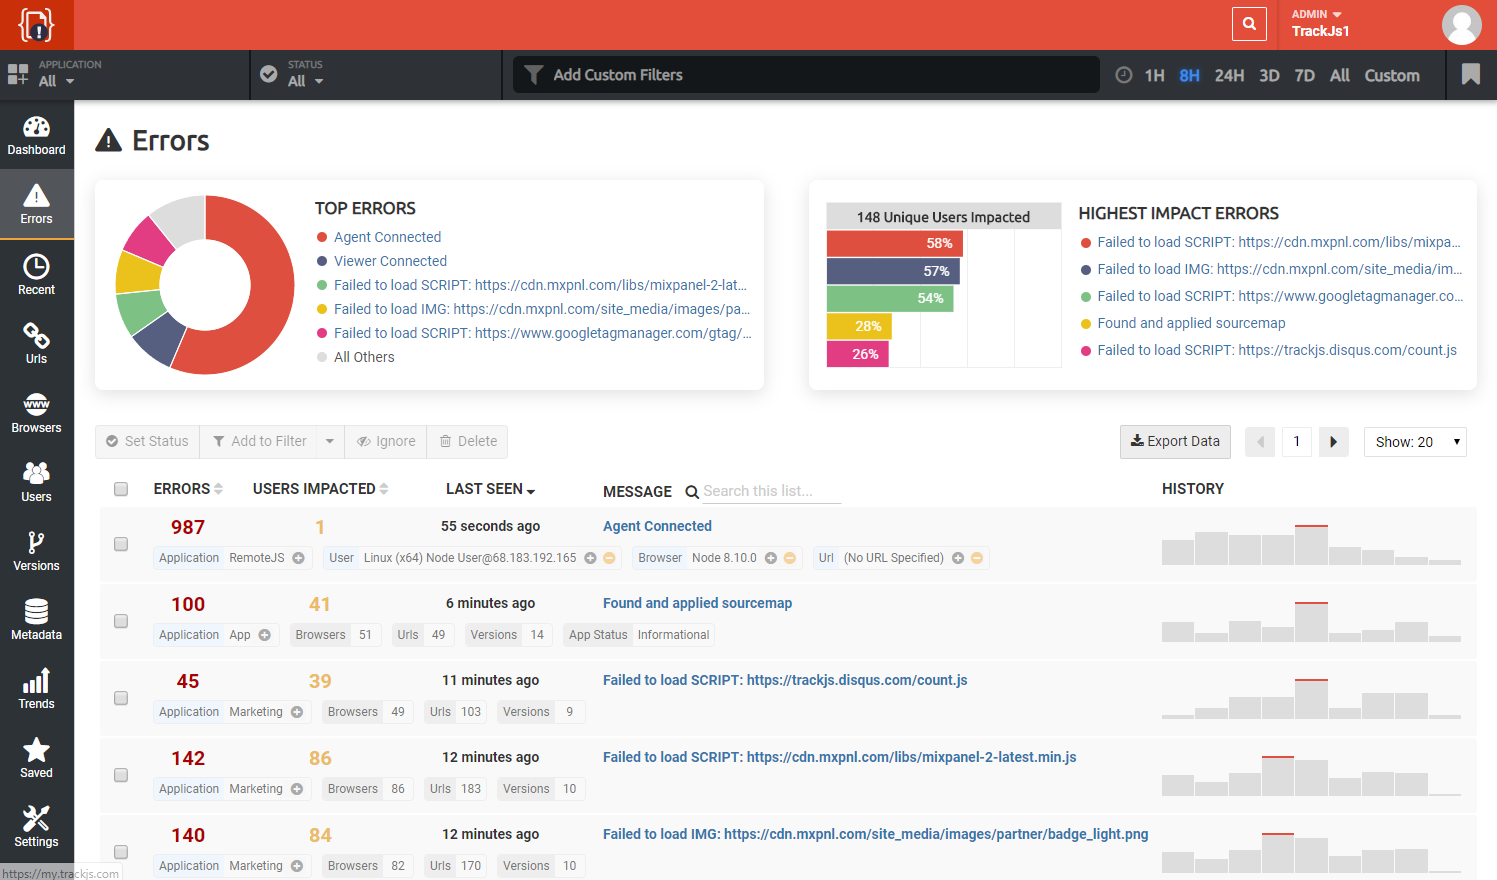
When you visit the “Errors” page in TrackJS we show you a paginated list of error messages and the number of times each one occurred. You can sort by most recently seen errors, the total number of errors, or number of unique users impacted. Essentially we’re grouping errors by their messages. In a relational database you’d do this with a GROUP BY clause. In Elasticseach this is called a Terms Aggregation. We’re essentially doing the same thing though - grouping a bunch of things by a single field (error message in this case).
But we can go further in Elasticsearch, and perform nested aggregates (groupings). For example, for each error message group we can also retrieve the number of unique browsers, urls, and users impacted, along with the versions of your code affected and a nice date histogram of occurrences of this group over time. We can get all of that for each item in our grouped list! This would be very difficult to do with SQL in a traditional database.
Grouping on High Cardinality Fields
Whenever you’re grouping instances of things by a certain field, the number of distinct field values plays a role in how fast that query will execute. Said another way, the query time will be directly proportional to the cardinality of the field being grouped. For instance, if you have a dataset with a million errors, but there are only 5 unique error messages, the message aggregate query will be very fast. There are only five possible groupings after all. On the flip side, if you can imagine the worst case, where every error message is distinct, every error message will be its own group and the query will be slow.
In our case it was these high cardinality customers that were experiencing slow response times. Their error messages contained URLs, and those URLs contained query string params with unique identifiers, so in effect every error message was different. When you’ve got hundreds of thousands of distinct error messages, that is going to be an expensive grouping operation! Given the realities of JavaScript error data though, we needed to figure out a way to speed things up.
Aggregating Faster
So our goal is fast error message grouping. The problem is JavaScript error messages can be variable length, and sometimes thousands of characters long. In Elasticsearch, aggregating over long strings is slower than aggregating over numeric values. Said another way, it’s faster to group by long values than it is string values. Wouldn’t it be great if we could aggregate over a numeric field instead of a string field? But how do we turn an error message in to a number?
We hash it!
We take all incoming error messages and hash them with the MurmurHash algorithm. We store the resulting 64-bit hash as a long inside Elasticsearch. This lets us group on a number field instead of a string field. There’s some gymnastics involved to turn a hash back to a string message, but that’s for another time.
The problem was, we were already using this trick to do aggregates, and we were still seeing slowness. And more concerning, we were seeing a huge increase in the amount of RAM required to handle each query. What else was going on?
The Culprit: Nested Aggregates
In order to surface even more meaningful data for our customers, we recently added 5 more nested aggregates to some of our core queries. That meant we’d first group all errors by error message, then we’d take each of those groups and calculate sub-groupings for the 5 nested aggregate fields (groups of groups).
Imagine you have 1,000,000 errors with 1,000 distinct error messages between them. You want to group all instances of the errors by message, and then for each message group also find some sub-aggregates (number of users for that message, browsers, urls etc), and then order them by highest number of occurrences.
Then you want to return just the first page of results, maybe 20-100 of them.
If you ask Elasticsearch to do that in one query, here’s what you get:
- Group all error messages together so you have an in-memory list of 1,000 message groups. (So far this is not too bad since we aggregate on the hash field value)
- Then, for each error message group, do the sub-groupings. This will necessitate many passes over the various field indexes of 1M errors. It will also explode the amount of memory needed to satisfy the query, as this is all being kept memory-resident.
- Once all groups and sub-groups have been calculated, order by message count. (again, to handle sorting we need the entire list of 1,000 groups in memory)
- Return the top 20, throwing away the other 980 aggregates
There is a lot of work being done that just gets thrown away. We are calculating sub-groups for hundreds of message groupings that we will never show the user. This is taking time, and eating memory!
Two Queries Are Better Than One
So instead of one big query, we decided to see what would happen if we made two passes. For the first query, we just retrieve the message groupings and do the sorting. We figure out which 20 error messages we’re going to show the user. This still takes time proportional to the error message cardinality, but we’re not paying for all the nested aggregates. For the second query, we enrich those 20 message groups with all the sub-group information, like date histogram, browsers impacted etc. It’s much faster to find sub-aggregates for 20 specific messages rather than all 1,000.
There’s a bit more code complexity involved with this approach since we’re making multiple queries and stitching the results together, but the performance improvements are impressive.
For our customers with normal error message cardinality, they won’t notice much of a difference. The two-query approach performs roughly the same as the single query for average datasets (the overhead of the second query negates any speed improvements). However, for our customers with large cardinality datasets, they will see an order of magnitude speedup in some cases! We think adding some application complexity is a worthwhile tradeoff to improve our customer experience!
We are always working on ways to surface more data and improve the performance of our application. Feel free to sign up and give TrackJS a try today!
