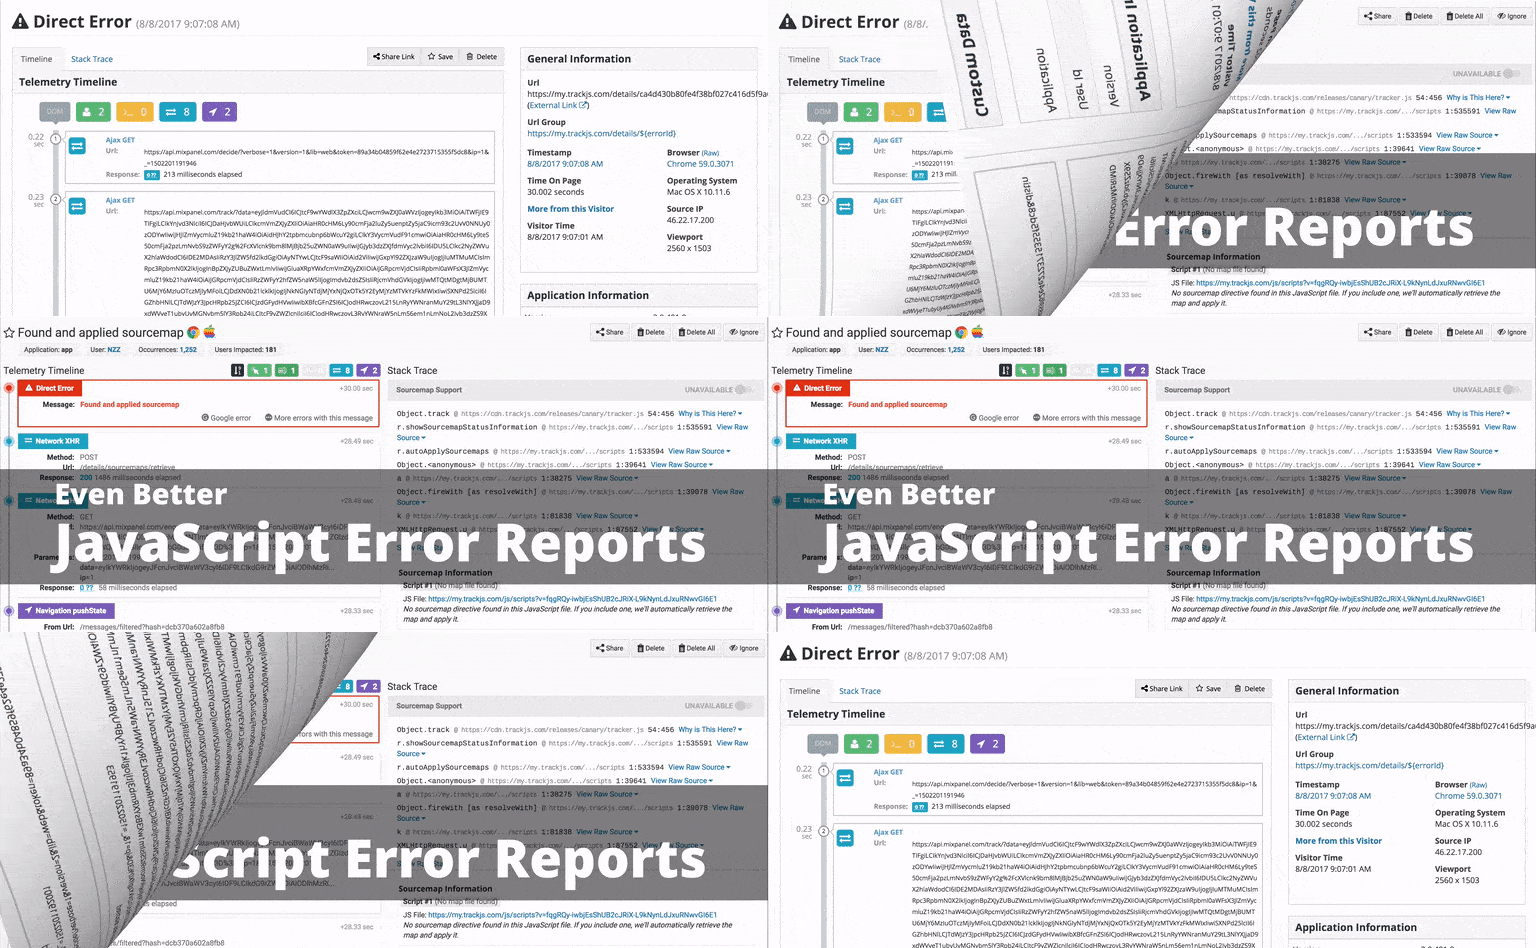
Four years ago, we launched TrackJS as A Better Way to Track JavaScript Errors and introduced developers to the Telemetry Timeline. Many JavaScript errors are difficult to understand without the context of prior events, and TrackJS continues to provide the best information available to help you fix bugs fast.
We recently launched a bunch of improvements to our error report UI that will make understanding JavaScript error stories even easier.
Error Quick Summary
The old page title was the error entry point, like “Direct Error” or “Catch Error”. In retrospect, this was not very useful. Although interesting, the entry is definitely not the most important thing to know; the error’s message is. So we retitled the page with some smart length detection, and included some quick tags to also see the Browser, OS, Application, and User impacted at a glance.

We’ve also included the total number of Occurrences and Users Impacted counts. This makes it easier to determine the scope of a problem and give you easy access to jump off to other occurrences of the error.
Even Better Telemetry Timeline
We started by flipping the sort-order of the Telemetry Timeline to show the error first and enumerated through prior events. This seemed to make sense for most errors, as the events most relevant to the error likely occurred last. We also gave you control to flip the order back.
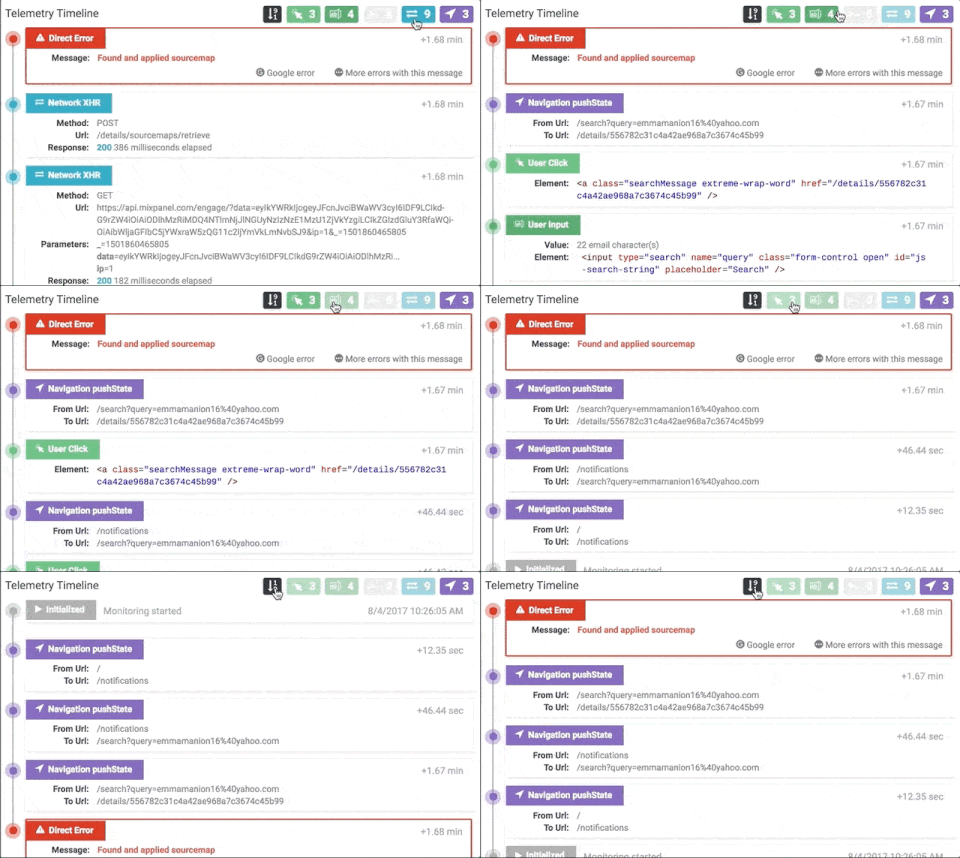
Error timelines get noisy, especially if your application has a lot of Network or Console chatter. So we gave you control to hide event types, which we hope will make it easier for you to discover the root cause faster.
Within the timeline, we’ve also expanded the information we provide about Network events, differentiating XmlHttpRequest and Fetch requests. And we parse out querystring parameters to make it easier to understand each request.
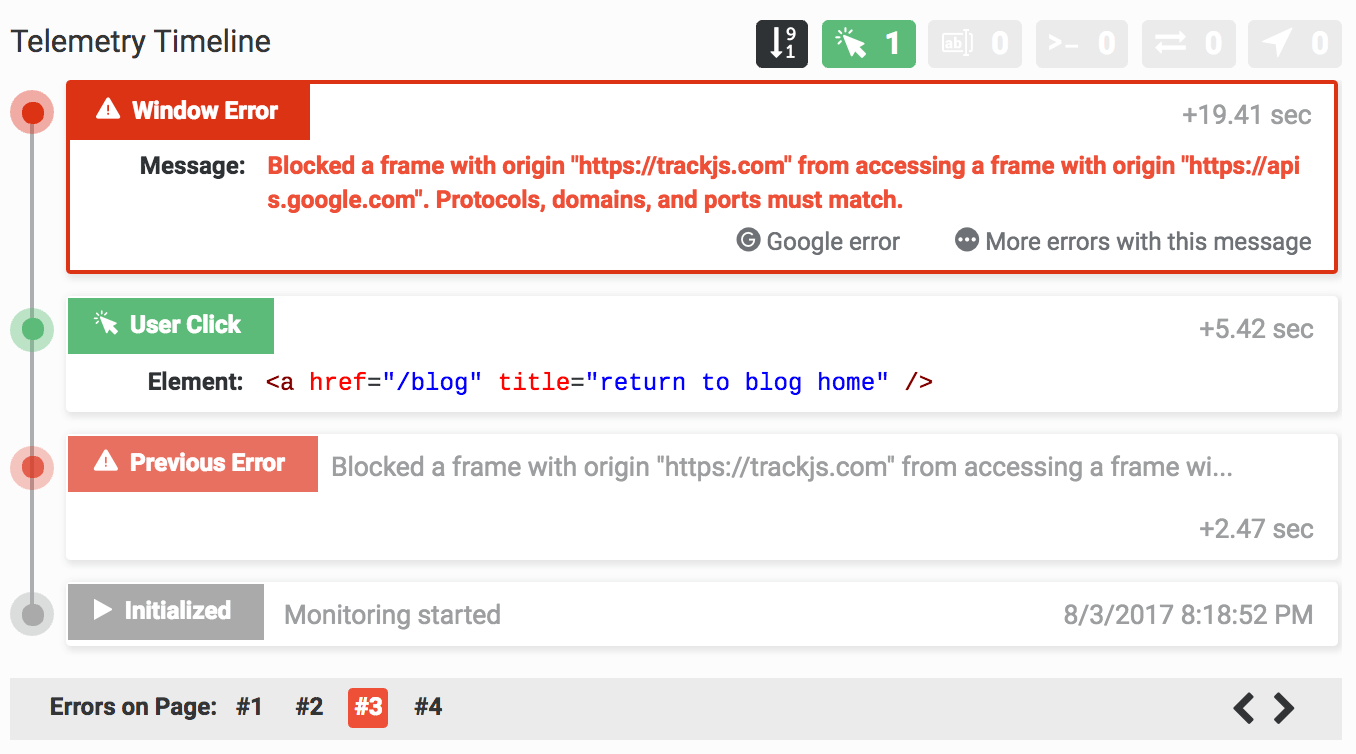
Multiple errors often happen within a single page view. Understanding them often depends on earlier errors. We made it easier to quickly see what the previous error was by including it directly in the Timeline.
Sometimes there can be dozens (or hundreds) of errors to navigate, and this would be tedious to navigate one-at-a-time. To address this, we built a pagination control just below the Timeline to quickly show you the scale of problems during the session, and let you navigate them easily.
Simplified Stack Traces and Source Maps
Processing and interpreting stack traces is one of the most complicated parts of our system. There are hundreds of JavaScript packaging strategies, and we want to show the best debugging information possible for each of them.
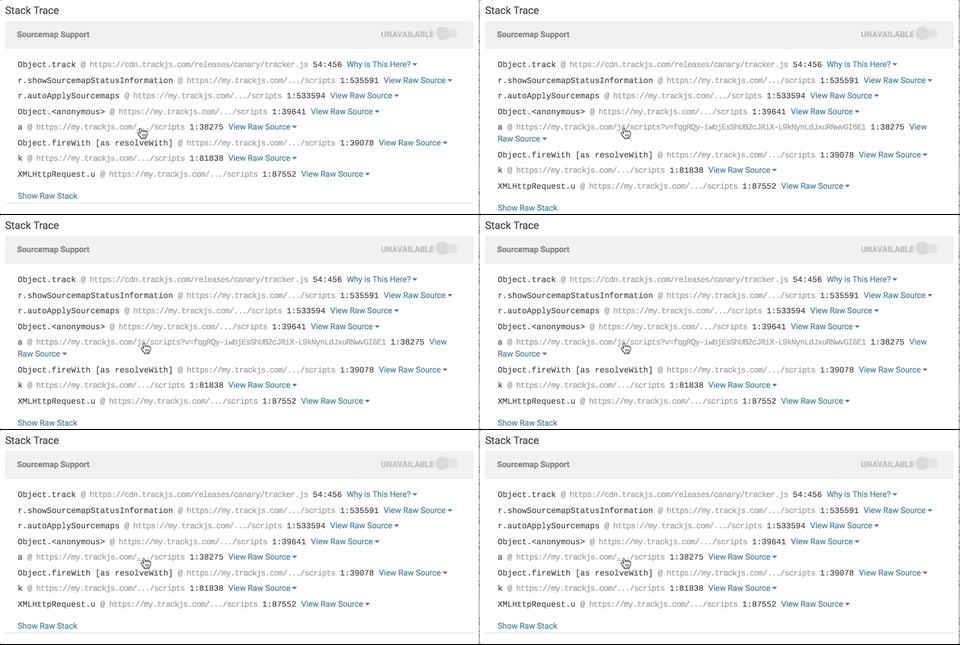
First of all, we added a smart URL shortener that strips off inner path segments and cache-busting query strings to make it easier to know which script is being referenced. It’s already been a huge help for me during our testing phase.
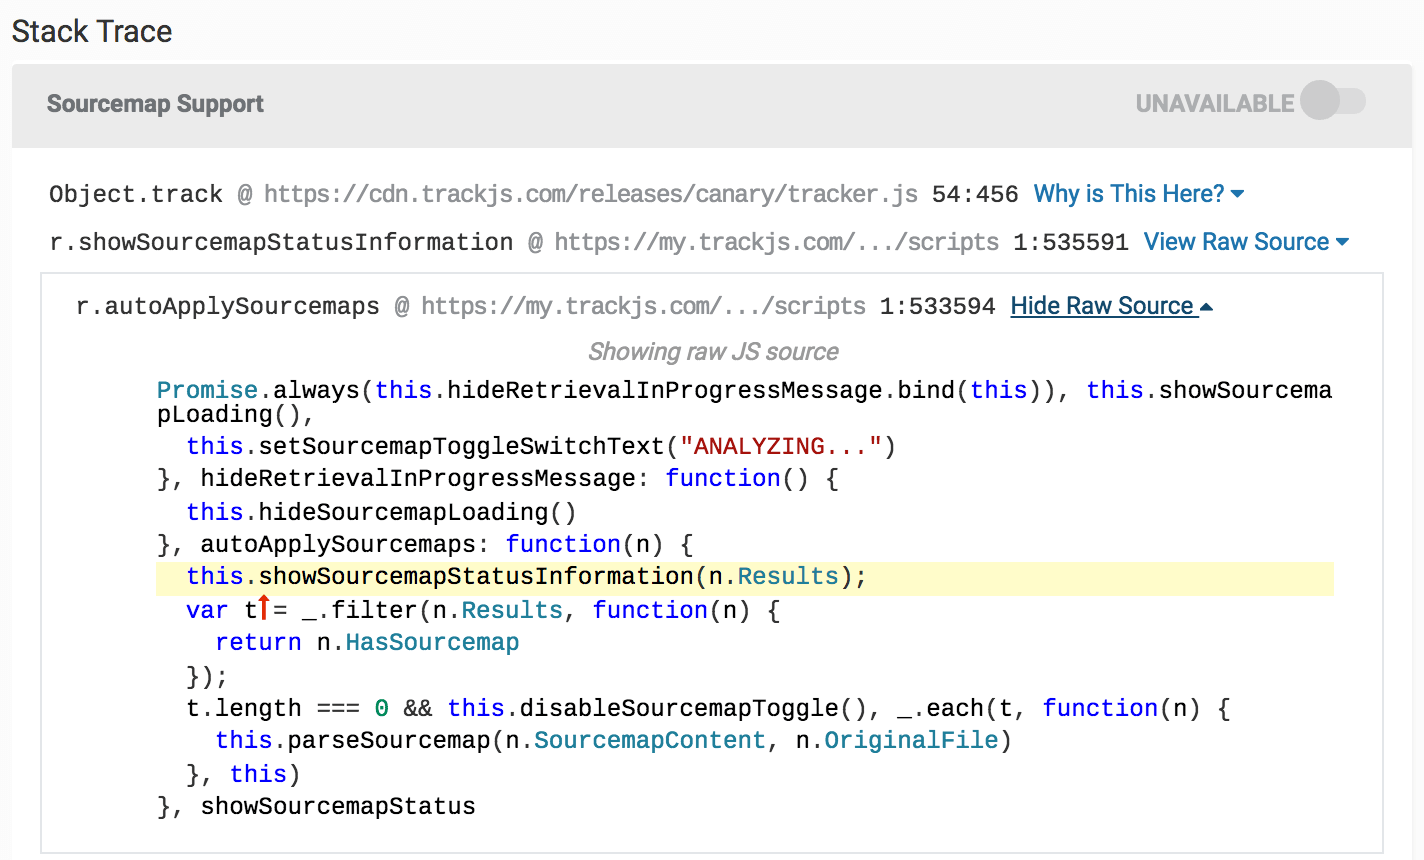
Inside each stack trace frame, we also added tons of little tweaks to show more actionable inline source code with better code formatting and highlighting and sourcemap support.
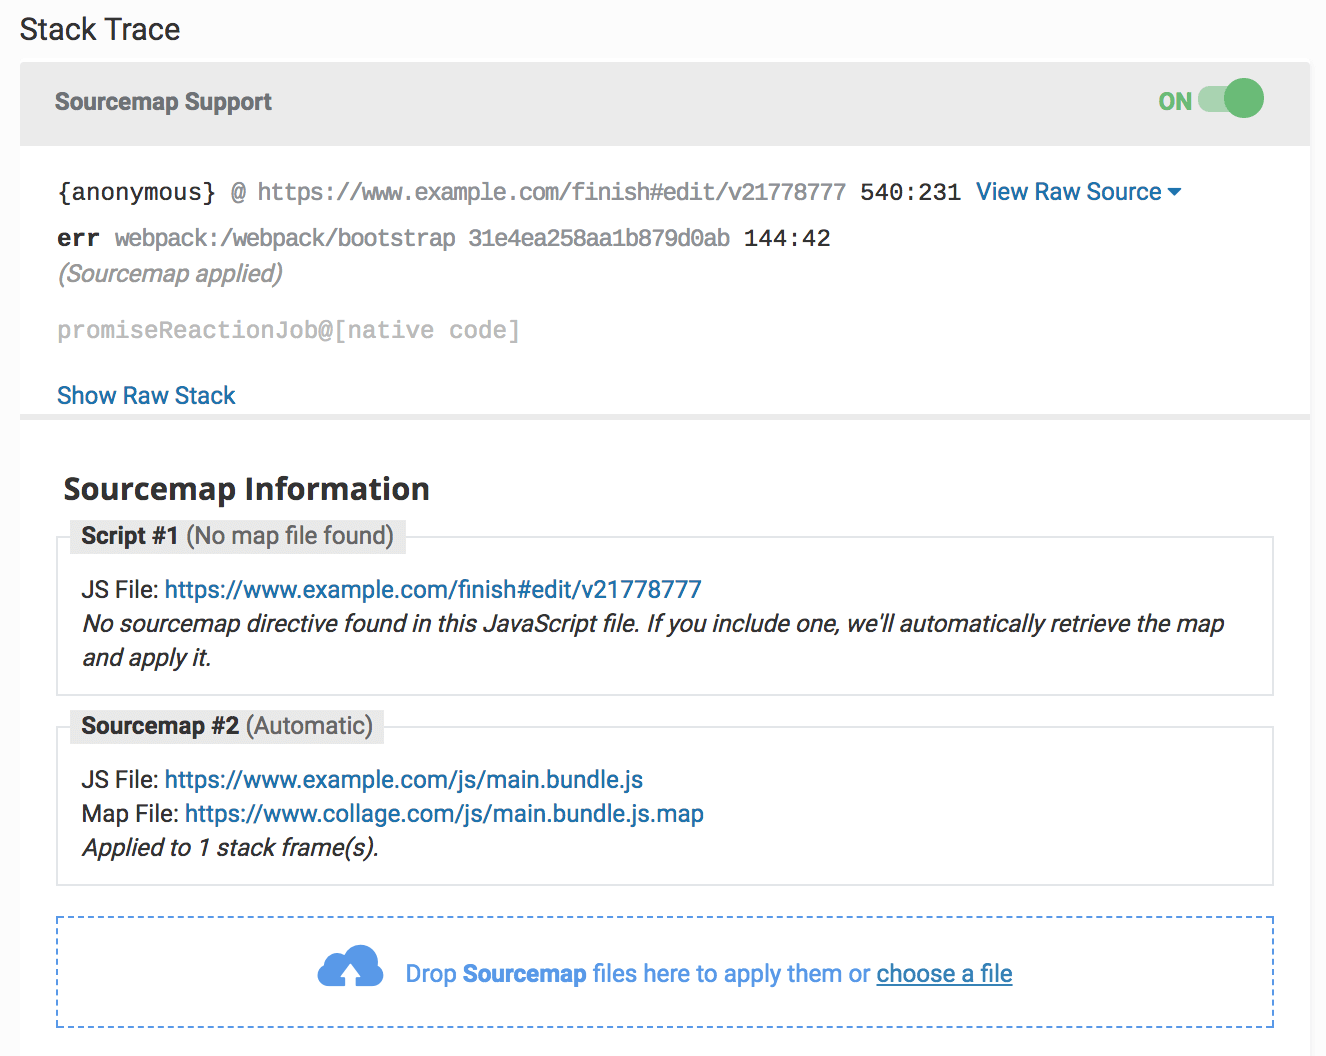
Speaking of source maps, we’ve added better visibility to when and how source maps have been applied to your errors. You can see which source maps have been detected automatically, manage your maps, and toggle source maps on and off.
We’re really hopeful that this update will make it easier to diagnose your errors, and make TrackJS an even more valuable tool for you. We have a lot more improvements coming, so let us know if there is something you’d like to see.
If you’re not currently a customer, why not start a trial now and have a look at it for yourself. It’s totally free for 14 days, no credit card required.

