Lessons Learned From A Buggy React Upgrade
React v16 is innovative. It comes with better error handling and new features like Error Boundaries, Fragment, Portals, Lazy, Memo, a new Context API, Hooks, Suspense, and concurrent rendering. I have been upgrading a large React code base from React v15 to React v16. This upgrade was clearly necessary but implementing is nontrivial on a large codebase. Thanks to the React team at Facebook, the migration path looks easy. Unfortunately, this was not the case.
First, I upgraded the react and react-dom libraries to v16 to discover the side effects. The result in the browser was a blank screen.
And this was me:

This is not the result you want to see when upgrading a library, especially one you use extensively. After a few seconds, I thought “ok, let’s start to research”.
In this article, we’ll go through the process of investigating and figuring out the root cause of the problem I had. I’ll share with you tips and best practices on how to investigate a bug, and how to fix it. In addition, I’ll teach you the relevant parts of the JS ecosystem, which are related to my use-case.
Tip 1: Getting Started
It’s a hard question to answer. There are a few options, and it depends on many factors. When I see a blank page, I try to understand first if I pressed enter in my address bar. Then I try to refresh. Click F12 / Open the dev-tool. Verify all log levels are shown (warning, error, info). Clear console. Clear networks. Refresh. If I see an exception, I try to figure out the reason by reading the error message. When it’s not enough, I click on the "Pause on exceptions” button in my dev-tool Source tab. Then I refresh and continue to check.
Chrome and other browsers’ development teams have been working hard to give us a wonderful debugging experience. They really care about it. Enjoy using it. Try the features. console.log is useful for specific use cases. Don’t misuse it.
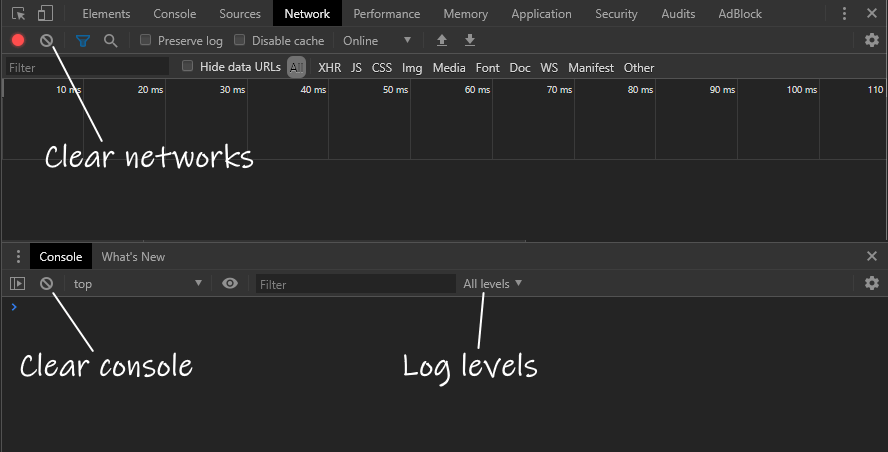
Ok, so let’s do it…
So, I clicked F12. What I saw was the same blank page. F12 didn’t respond. Then I clicked the right button of my mouse. The same. So, I wanted to close the tab. Nothing. My browser was stuck. And this was me:

Tip 2: Take a Break
Don’t break your keyboard. Your browser gets stuck because people are not machines. Developers make mistakes. It’s reasonable. And if you think “Oh maybe the computer made a mistake, let’s run it again”, you will probably waste your time. 1 + 1 is 2, and it doesn’t matter how many times you run it.
I think that each company has to have a rage room in its office. And this is a great time to go there. If you don’t have one, please calm down, drink water, open your mind, and continue reading.

Ok, so let’s continue…
The next step I tried is to switch my browser. It didn’t fix the problem, but it can give you more information. My tab was stuck. So it wasn’t a browser-related issue. Here I had an intuition that because of the state of the tab, I had an endless loop. But I didn’t know where. So I decided to sow console.log and debugger into the code. This proved a waste of time because I had a huge codebase.
Then, I went through was to disable big parts of my code. This method gives you more information about the problem because you can eliminate components. But it can produce other bugs and issues which drop you from your way to solve the issue. After a few more hours, I decided to drink a cup of coffee and come back with a different approach.
(Big-Mega-Huge) Tip #3: Stop Script Execution
I understood my problem wasn’t going to be solved so soon. I had to try something else. I decided to search on the web “how to stop an endless loop”. After a few minutes of reading, I found some tricks to use. But they didn’t work for me. Then I found another one - there is a button in Chrome’s dev tool called “Pause script execution”. It’s a toggle button with two states.
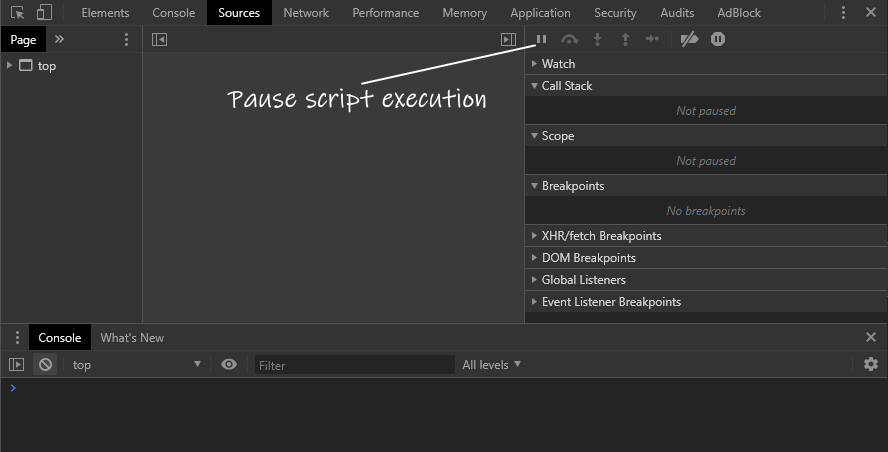
I was familiar with one state - “Resume script execution”. This is the button I click when I stop on a breakpoint and want to continue to the next breakpoint. I had never known what happens when I click on it while the code is running. The result was amazing - I had succeeded in stopping the loop. And this was the section of code (after removing unnecessary lines of code):
let doneRendering = false;

ReactDOM.render(element, container, () => {
  //... //
  doneRendering = true;
});

while (!doneRendering) {}
The debugger stopped at line 8: while (!doneRendering). And this was me:

Tip 4: Know Your Ecosystem
JavaScript is single-threaded. We have one thread for both the code and the UI. If our thread is too busy running our code, the UI isn’t responding. What does ‘too busy’ mean? Using synchronous code means that our UI can respond only when the code finishes running. Our UI interaction is event-driven. Event handlers (functions) will be entered in the callback queue displayed below along with another crucial building block in the JS mechanism - the call stack.
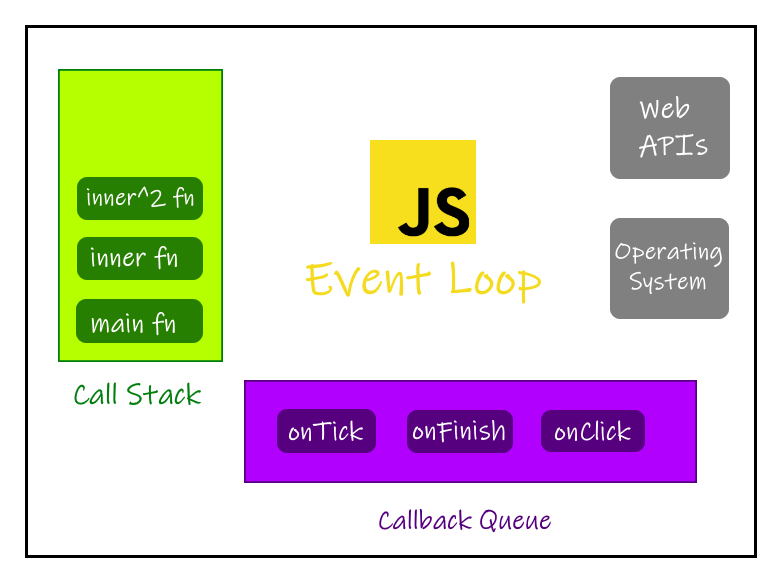
When a function is called, it moves to the call stack. When a function finishes running, it pops out of the call stack. The Event Loop is in charge of managing this mechanism. When the call stack is empty, i.e., all our synchronous code finishes running, the event loop takes a function from the queue, runs it and puts it in the call stack. When this function ends running, it happens again with the next function in the callback queue.
Tip 5: Don’t Use Busy Waiting in JavaScript
Functions inside the callback queue wait to be moved to the call stack. This means that when we run a synchronous loop like in our case, all the UI interactions and other asynchronous callbacks are in “waiting mode”.
Let’s go back to our code:
let doneRendering = false;

ReactDOM.render(element, container, () => {
  //...
  doneRendering = true;
});

while (!doneRendering) {}
This section of code demonstrates ‘busy waiting’. It’s a real code example. Busy waiting is a technique in which a code repeatedly checks if a condition is true. Here we have a loop which will not let any other line of code run except code inside the loop. Our loop is empty. If doneRendering is false, we are stuck forever, and our browser is stuck. And this is the case in my code. Busy waiting is bad practice.
Well, the big open question is how the code worked before React 16? The callback was called synchronously before the loop, so doneRendering was true. This loop condition was never satisfied in React v15. I.e., the callback was called synchronously with v15.
Tip 6: Make it Asynchronous
Do you want your users to be stuck with a blank page? Do you want to hold up the single thread you have? You are in the JS world. You have only one thread. In the browser, it’s the thread which also handles the UI. If you use busy waiting,
- Your UI isn’t responding
- Your UI isn’t visible
- Your browser is stuck
- Your user is out
What do you do when you see a blank page? Leave the website. What do you do when your browser is stuck? Leave the website and curse. Let’s use asynchronous code to fix our problem.
function myCode(element, container) {
  return new Promise((resolve, reject) => {
    ReactDOM.render(element, container, () => {
      //...
      resolve(...);
    });
  });
}
Now, our function returns a promise which will be resolved when the callback will be called. That’s all. No busy waiting. No blank page. No stuck browser. Free day. Happy day.
Conclusion
During this journey, we have gone through my React v16 migration use case. It might sound too specific at the start, but it isn’t. This is a common experience for a developer. Trying to understand what is the bug. There are a lot of ways to investigate a bug. There are a lot of ways to solve a bug. Know your arsenal of options, including production error monitoring for your react application from TrackJS. Choose your pattern. Use your tool-set. Know its features. Understand your language’s ecosystem. Believe there is gray. And don’t forget - from time to time, visit a rage room.
