One of the hardest parts of client side error tracking is giving the customer meaningful signal from a sea of noise. The internet is a hostile place, and errors occur for all kinds of reasons. We noticed that sometimes, even with all of our filtering, it was possible for certain errors to slip under the radar. On a busy site there might be hundreds of errors occurring per minute. How do you know what’s important, versus something that’s just noisy?
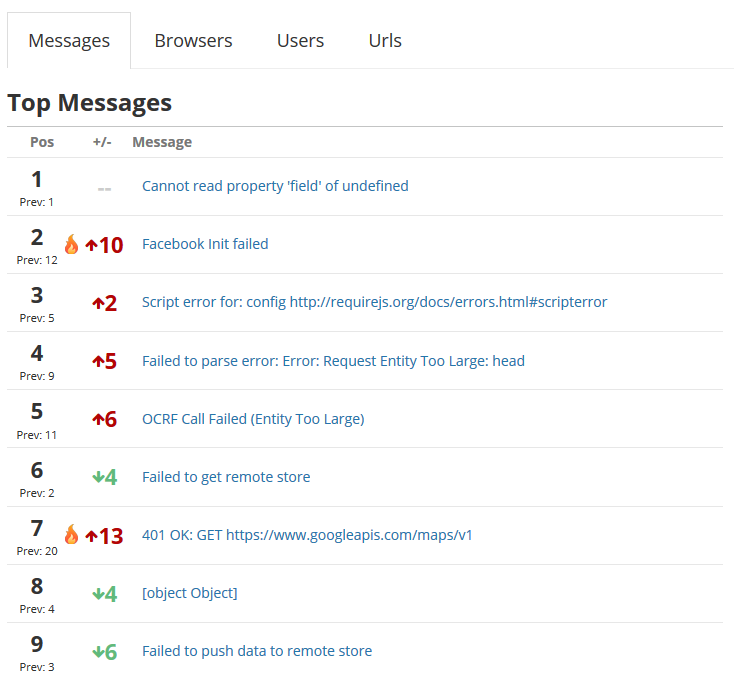
We decided to take a page from the music Top 40 charts and apply it to JavaScript errors. When you visit the Trends page you’ll see the top errors over the past 24 hours, their current and previous positions, and those that have moved up or down the most. If an error has moved more than 10 places we’ll denote that with an icon that says “hey, this is interesting and might be worth looking at.”

So what can we tell from this? For one thing there’s a decent chance that something is wrong with the Facebook script initialization. It looks like there might also be something wrong with the way we’re authenticating with Google Maps.
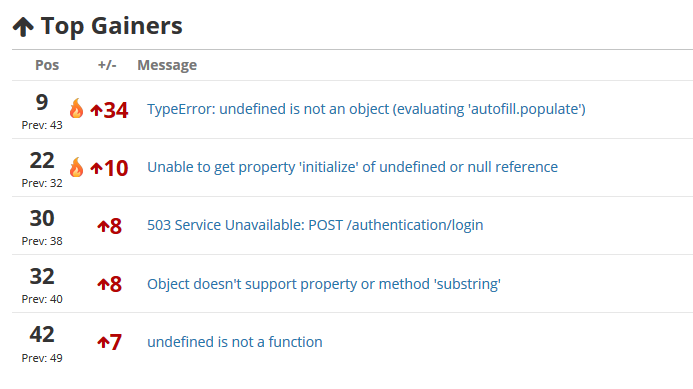
We also surface the top movers, sorted by number of positions moved. This is to expose errors that might not be occurring constantly, but are getting much worse, relatively speaking.

The TypeError isn’t the most common occurring, but its movement suggests it’s getting worse, and should probably be investigated.
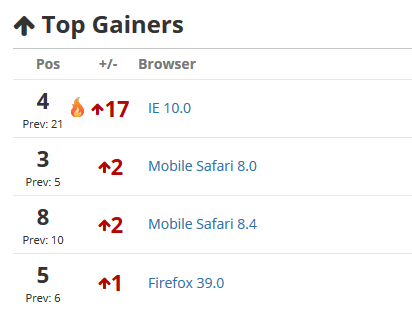
We also allow you to see things besides messages. You can look at the trends for urls, browsers or user id.

Maybe there’s an issue with IE 10? As if there weren’t enough of those already :).
Finally, we also show you which errors are dropping the most – this can be corroboration that a fix is working, or that a system is back up and functional again.

Overall we hope that this is a new and interesting way to visualize your data, and hopefully leads to more bugs fixed! Check out error trends and fix tons of JavaScript bugs with TrackJS! Get a free 14 day trial.


