

With the proliferation of JavaScript transpilers, sourcemaps have become an integral part of the front-end development. If you’re using Angular, React, Om, Elm, or others, there are huge advantages to debugging by using sourcemaps. We’ll show you what they are, how to use them, and some things you can do to get even better information.
Why Care About Sourcemaps?
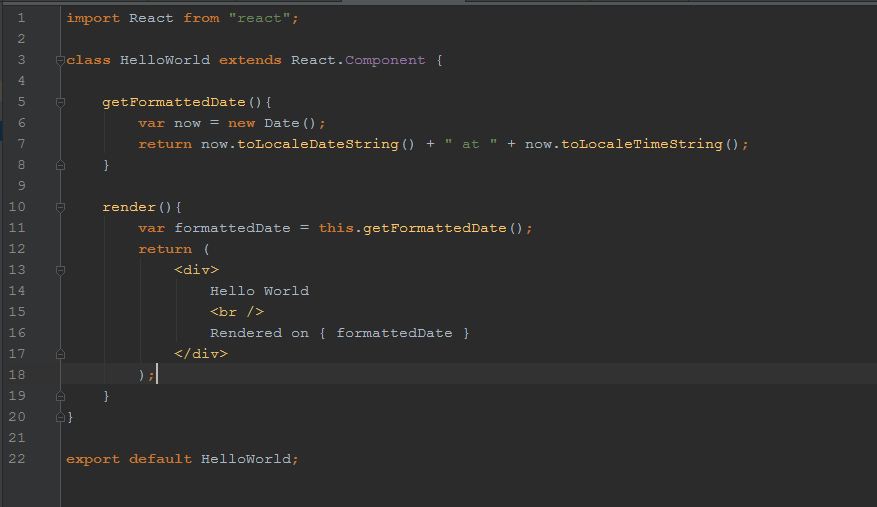
Imagine we have a very simple React component, written in ES6. All it does is print “Hello World” and the date it rendered.
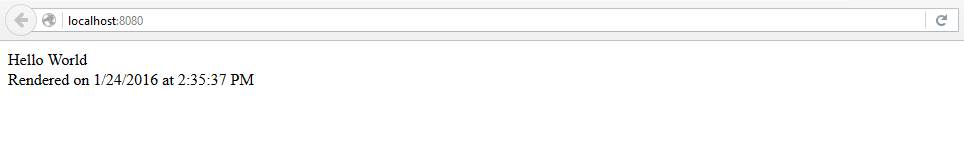
To make this component, we’re using ES6 classes, the ES6 import syntax, and we’ve also got a little bit of JSX thrown in for good measure.
Of course, this code won’t run in browser. We need to transpile it with something like Webpack or Babel before a browser can understand it. Transpilation takes our pretty ES6 and JSX and turns it in to lowest-common-denominator ES5 JavaScript. Unfortunately, transpilation doesn’t always produce straightforward output. Here’s what our slick component looks like to your browser:
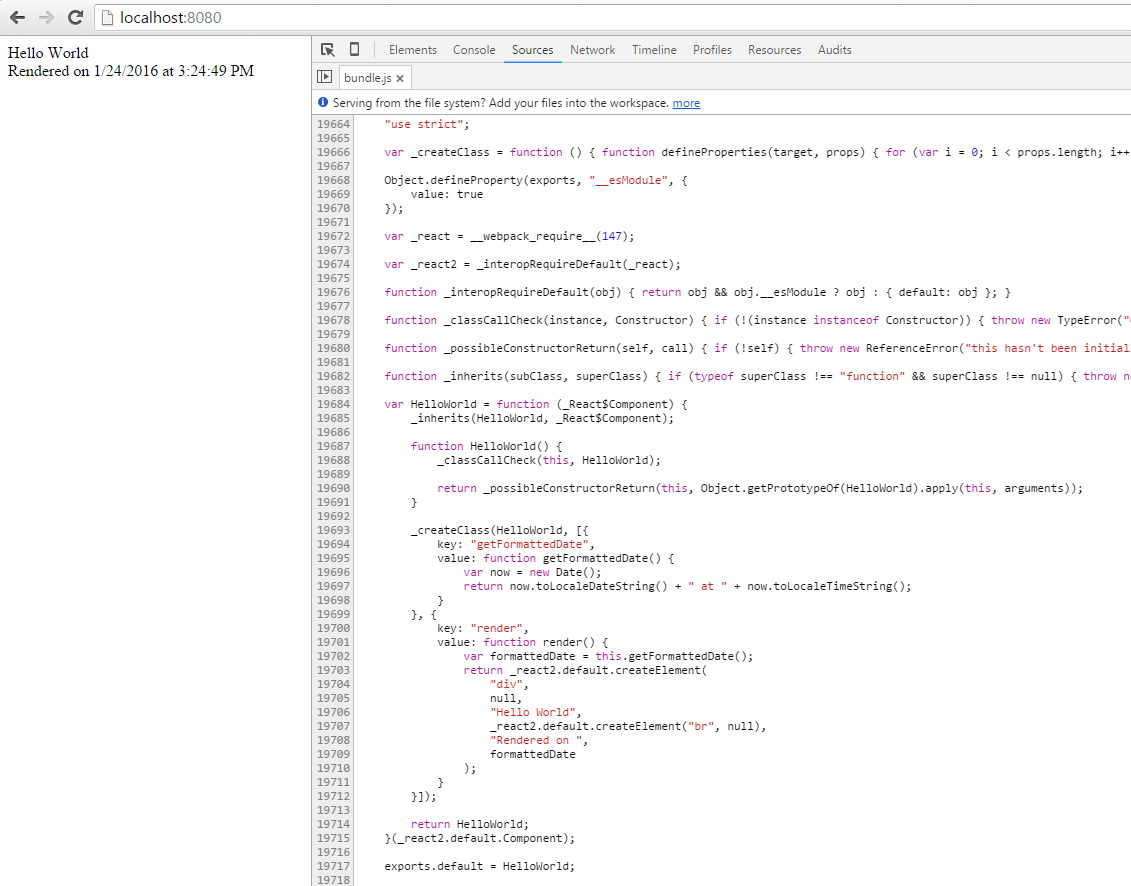
Ack! Our beautiful ES6 and JSX syntax has turned in to unreadable muck. What if there’s a bug in this code? How do we fix it? For that matter, where do we fix it?
Enter the Sourcemap
A sourcemap is a mapping between the generated/transpiled/minified JavaScript file and one or more original source files. The main purpose of sourcemaps is to aid debugging. Basically, if there’s an error in the generated code file, the map can tell you the original source file location. That’s it. It’s pretty powerful in practice!
Both Chrome and Firefox currently support the processing of sourcemaps in the developer tools. Additionally, logging & monitoring tools like TrackJS are supporting these maps as well.
TrackJS supports sourcemaps automatically if you make your source maps public, or privately via our analytics console. Get great information about your production environment today with TrackJS! Grab a free trial and let us know how we can help.
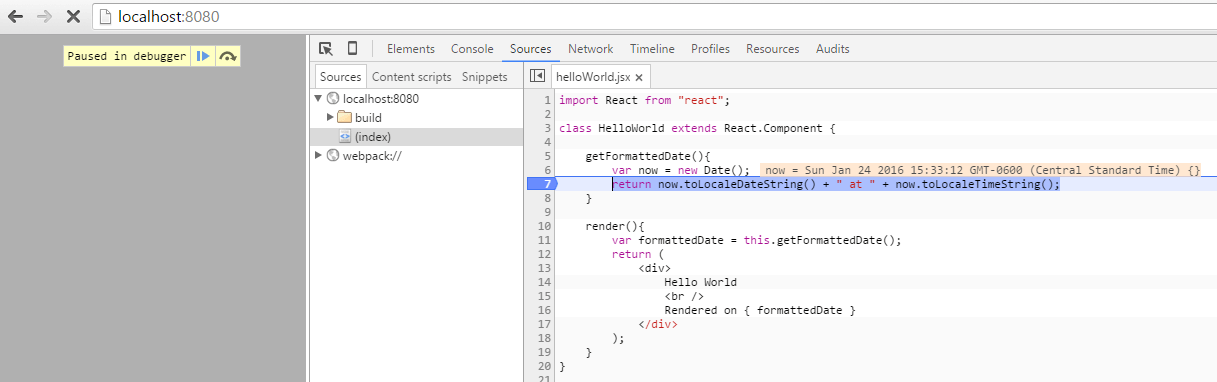
Using our HelloWorld component, coupled with sourcemaps, we can now see that Chrome has found the sourcemap, and applied it for us. Even though it’s garbled ES5 JavaScript executing, Chrome has performed the mapping back to our original source.
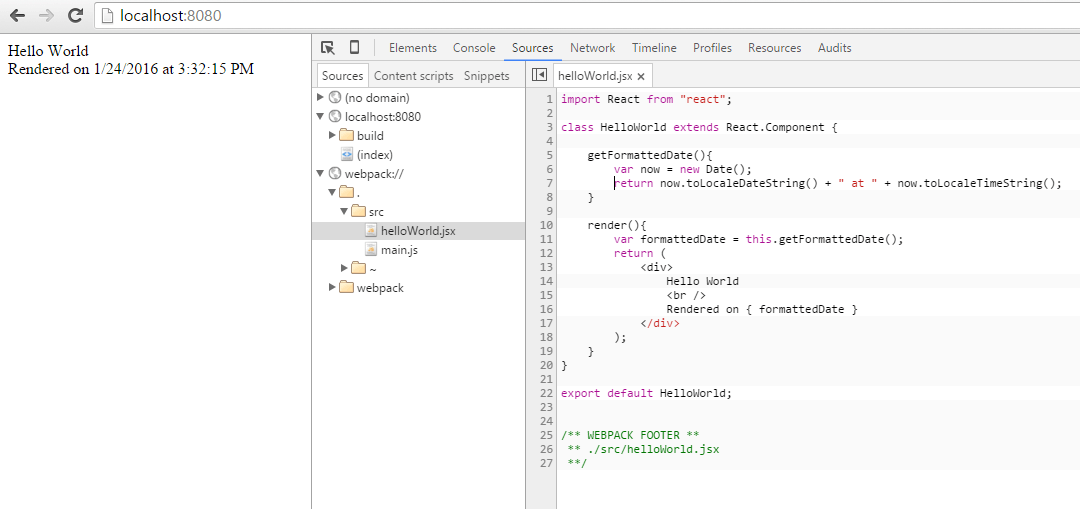
You know what else is cool? We can even put breakpoints in the original source code, and Chrome is smart enough to handle that for us!
Sourcemaps Are Awesome, How Do I Use Them?
To use sourcemaps, you must first generate them from your original scripts. There are a number of tools out there that can generate sourcemaps from input files. In fact, there are so many it’s almost a certainty that whatever language you’re using and converting to JavaScript is covered. For an exhaustive look at what’s out there, Ryan Seddon put together a great wiki on the topic.
Let’s go back to our HelloWorld component. We’re using Webpack, so in our case, generating a sourcemap is a simple configuration tweak. Within our webpack config file, we set devtool: "source-map" and we’re good to go.
{
	// Other stuff like entry, output, modules
	// ... and then
	devtool: "source-map" // thats it!
}
Once we’ve added this option to our configuration, we’ll start seeing a sourcemap produced as output alongside our transpiled code. In our example, we called our output JavaScript file bundle.js. By default Webpack will now start producing a bundle.js.map as well. If you crack open the map file, it’s just a JSON blob. A mostly non-human readable JSON blob. If you’re interested in all the gory details that make up the map file, check out the most current version of the Sourcemap spec.
One other interesting thing happens as we begin generating sourcemaps. At the end of our transpiled file, we now see a weird bit of code
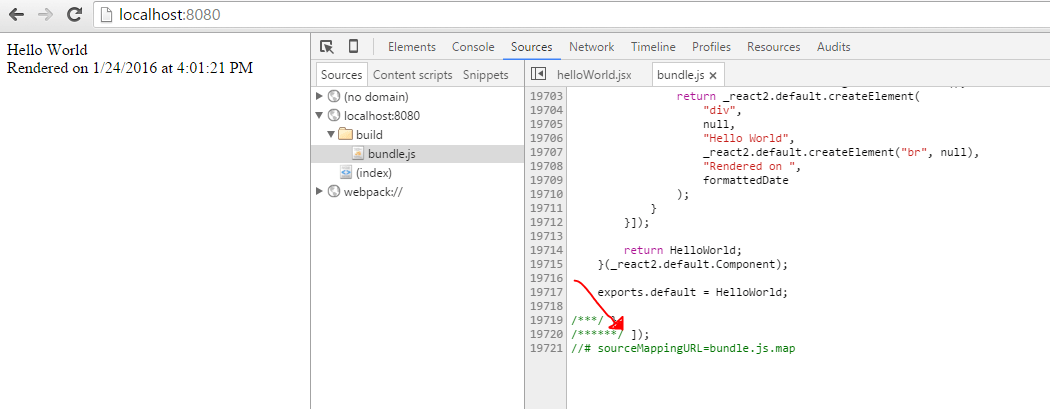
This is the key piece that tells our browser where the sourcemap lives that applies to this particular file. Once this is in place, and the map is present, Chrome will perform the sourcemap replacement magic.
Tracking JavaScript Errors in Production
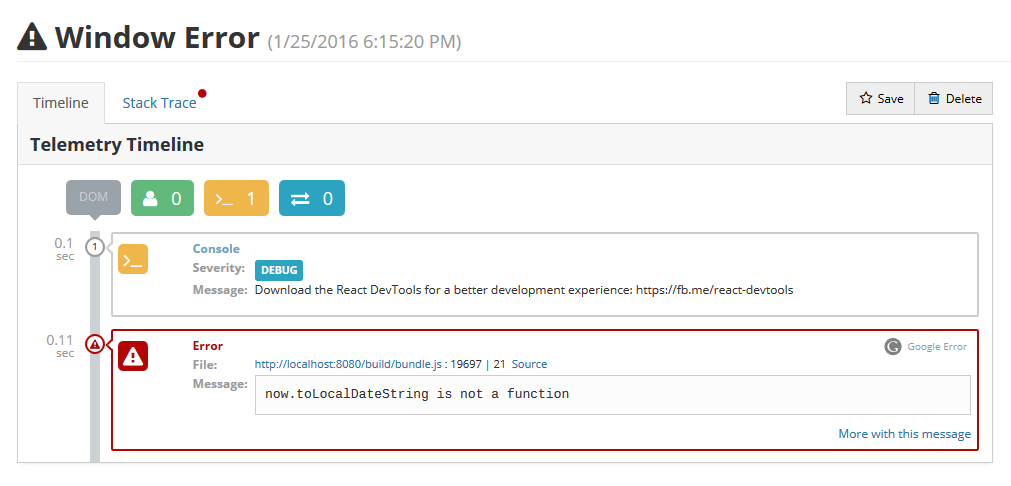
Pretend we have an error in our HelloWorld component. Maybe instead of calling toLocaleDateString() we accidentally call toLocalDateString(). Our customers are getting all kinds of white screens because our component isn’t loading.
Chrome and Firefox give you a great development time experience with sourcemaps, but what happens when a customer gets an error in production? You can’t easily ask them to open their console and report the file and line number!
Fortunately, TrackJS automatically loads sourcemaps and applies them to error stack traces for you. (The red dot above the Stack Trace tab appears when a sourcemap was found and automatically applied)
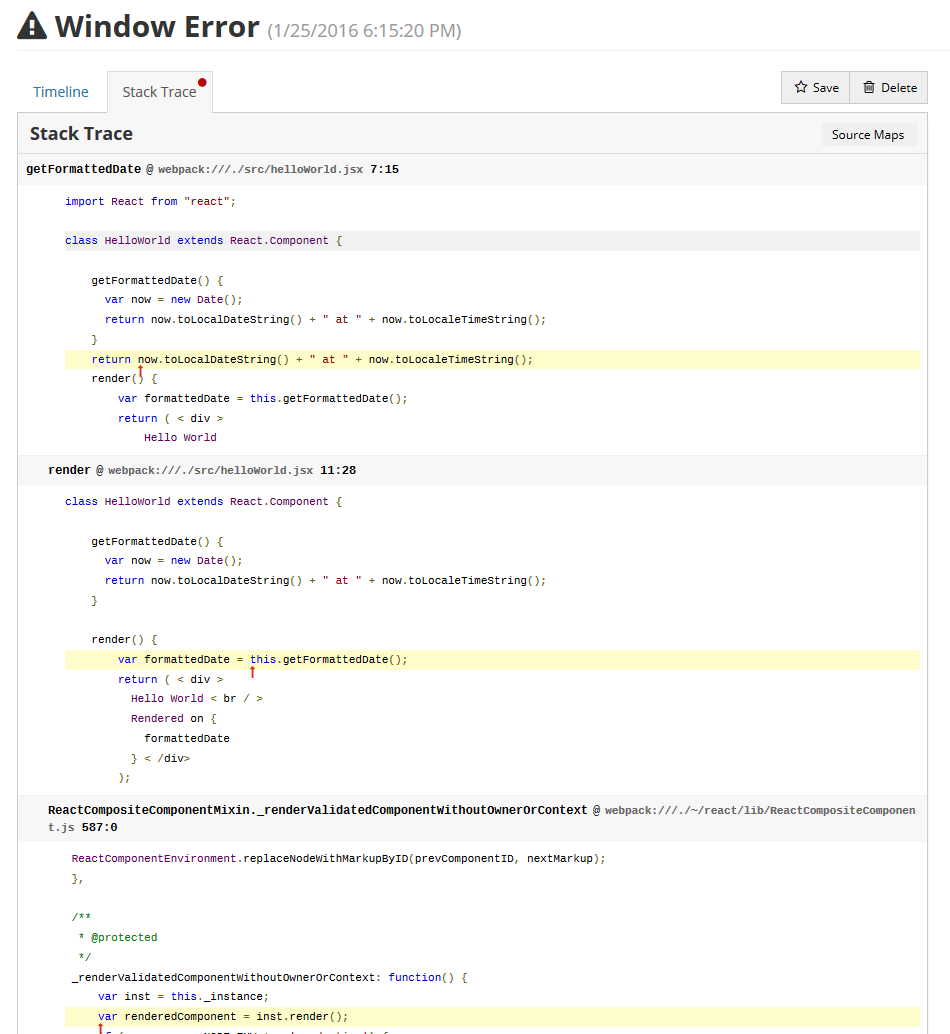
Our servers were able to retrieve, and apply, the sourcemap for the stack trace. You get the actual original ES6/JSX code, and a nice pointer to where exactly the error occurred. You can see we even get a look inside the React source as we move down the stack!
Conclusion
Sourcemaps are an important weapon in the front-end arsenal, and more and more tools are supporting them. If you’re developing with the latest client side technologies, you need to make sure you have an excellent debugging and monitoring story as well! Sourcemaps (and TrackJS) are important keys to ensuring that. Let us help you be awesome at debugging today. Sign up for a free 14 day trial of TrackJS!
