There’s a lot of JavaScript developers these days not actually writing code. They whisper sweet prompts to our AI tools and hope for the best. Is it really any worse than copy-pasting from StackOverflow? Welcome to the era of vibe coding, where understanding your code is optional and “it works on my machine” has evolved into “the AI said it would work.”
When the Vibes Are Not Good
I was helping a junior dev last month debug a Vue project. The project? Written entirely by Claude. The bug? A classic race condition that anyone who’d written async JavaScript would spot immediately. But here’s the thing—I don’t think they’d ever written any async JavaScript. They’d only ever prompted for it.
This is our reality now. Developers prompt their way through features, copy-paste their way through code reviews, and have no idea how to push through errors in their approach. Debugging code you didn’t write requires a completely different skillset.
We prompted our way into this mess. Can we prompt our way out?
We’re going to try! Introducing the TrackJS AI Code Debugger.
The AI Debugger takes your existing TrackJS error reports—complete with stack traces, telemetry data, and execution context—and translates them from “cryptic browser tantrum” into “here’s what actually went wrong and how to fix it.”
Vibe Debugging In Action
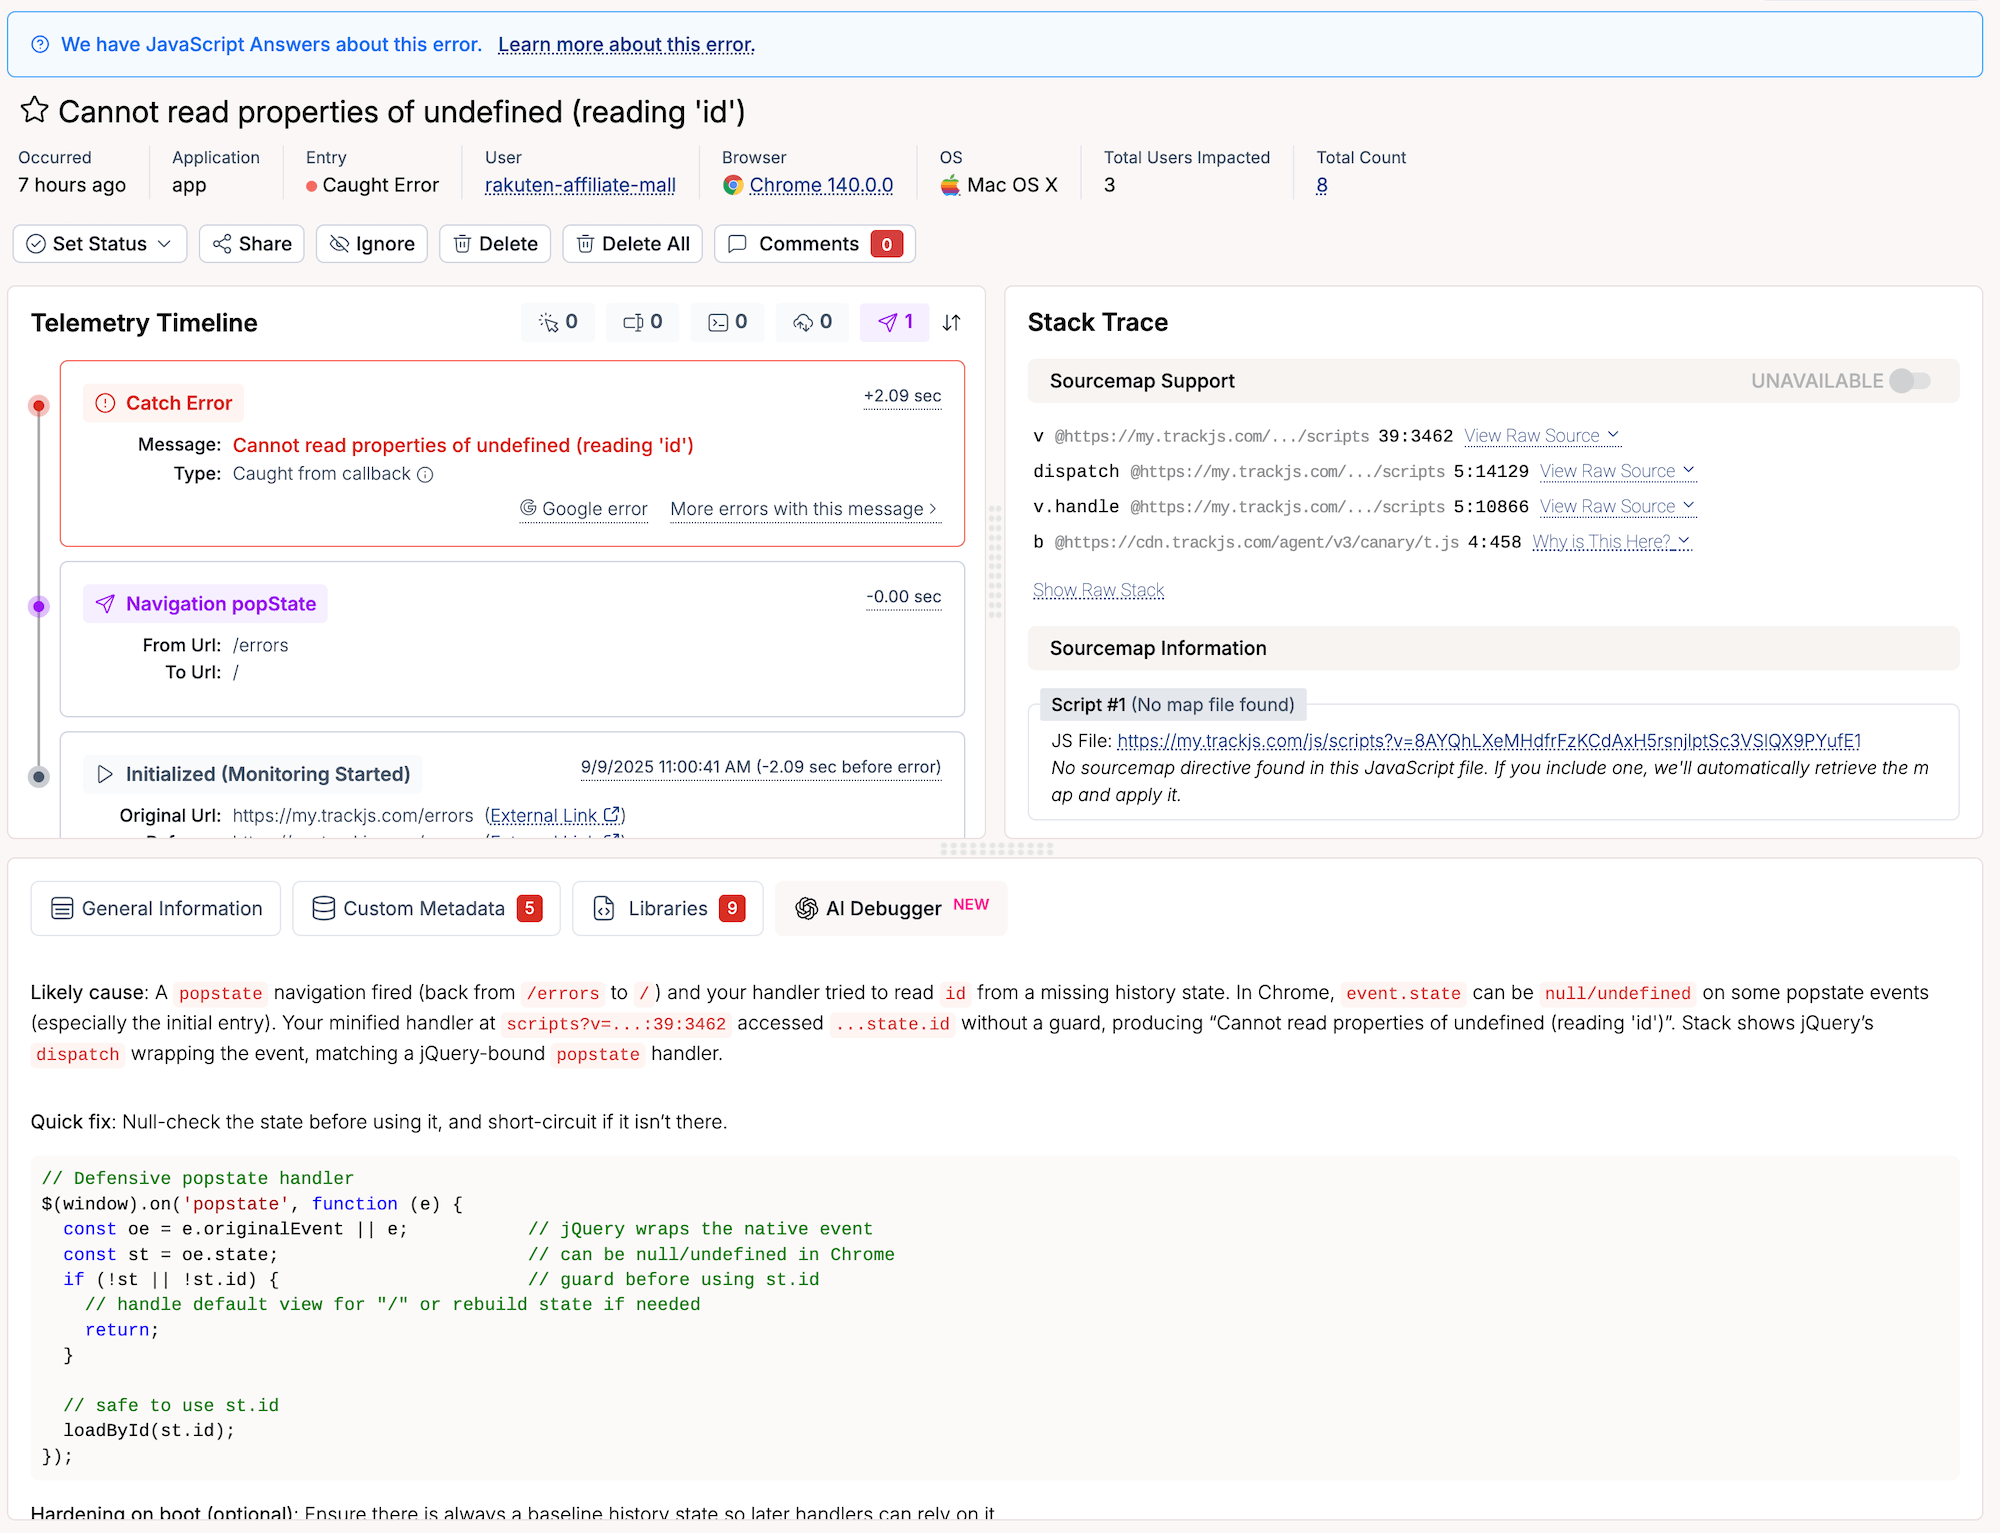
We had this error pop up for a customer recently:
Cannot read properties of undefined (reading 'id')
We’ve seen this one a lot. In fact, it’s one of the most common JavaScript errors and I did a writeup about how to debug it. Can the TrackJS AI Code Debugger provide better insights than my hand-crafted, artisanal debugging content? I hate to say it, but yes it can.

The AI Debugger knows everything about the error, the Telemetry, the stack trace, and even the source code that was running. With all this context, it can show you really detailed information about both the error, and the specific reasons why it happened.
Likely cause: A popstate navigation fired (back from /errors to /) and your handler tried to read id from a missing history state. In Chrome, event.state can be null/undefined on some popstate events (especially the initial entry).
It even adapted the original source code with a safety check to prevent the error:
// Defensive popstate handler
window.addEventListener('popstate', function (e) {
  const oe = e.originalEvent || e;           // jQuery wraps the native event
  const st = oe.state;                       // can be null/undefined in Chrome
  if (!st || !st.id) {                       // guard before using st.id
    // handle default view for "/" or rebuild state if needed
    return;
  }

  // safe to use st.id
  loadById(st.id);
});
More Debugging Vibes
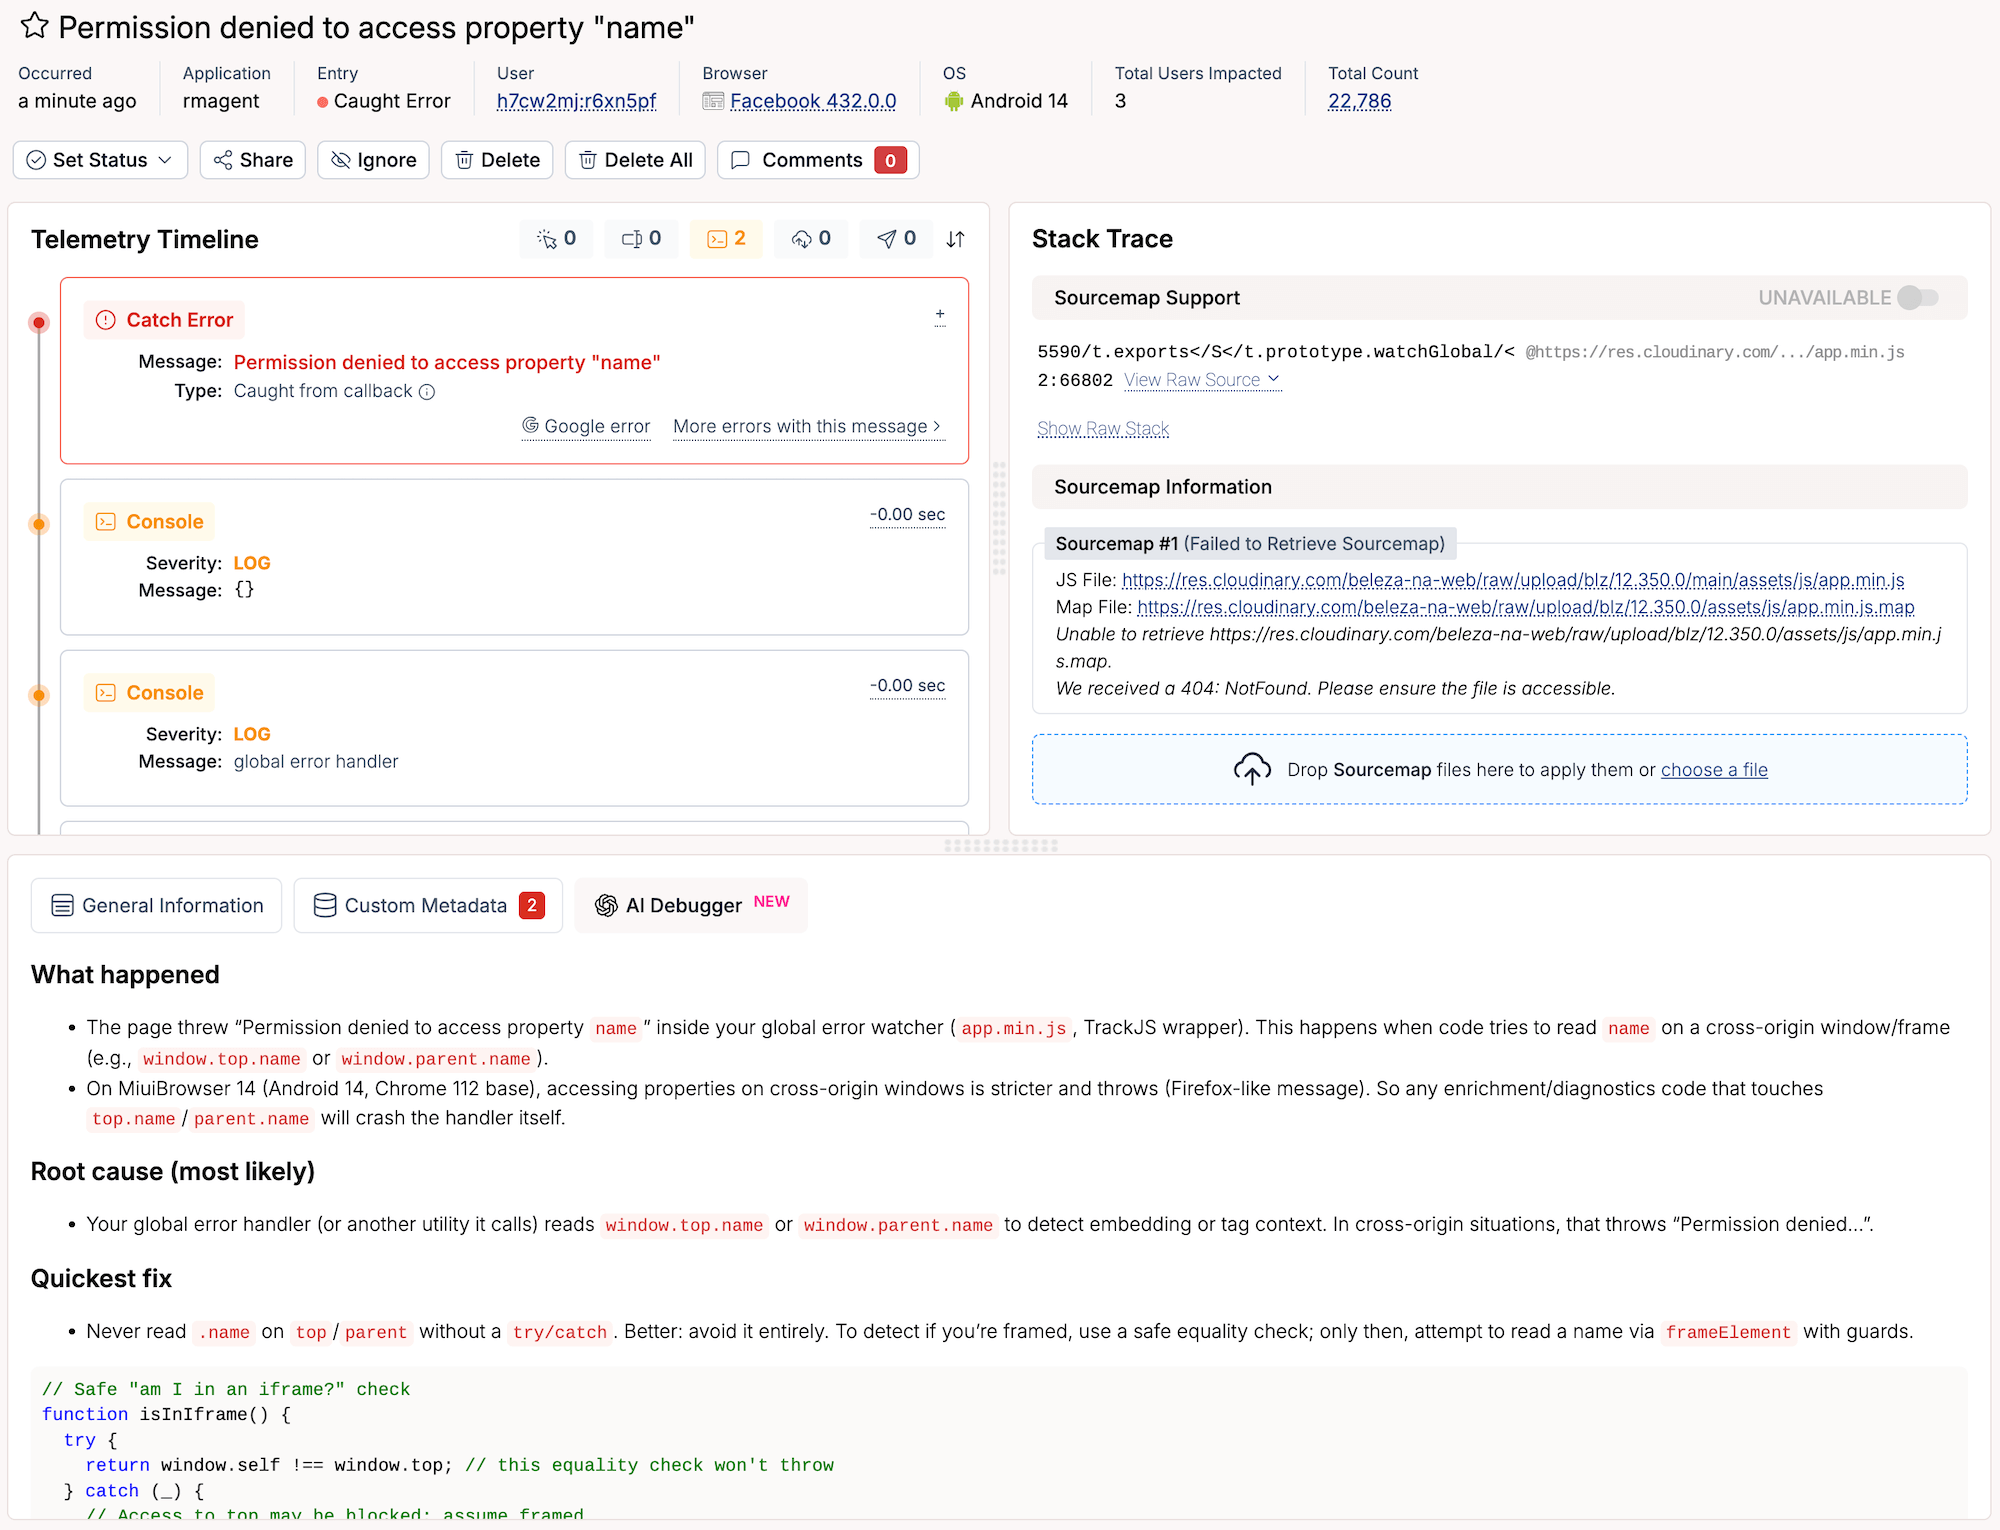
Here’s another example from something way more specific:

This one comes from the Request Metrics agent, running on someone else’s website. We run into all sorts of weird things that happen in environments, and this really helpful to understand how a particular niche browser behaves:
This happens when code tries to read name on a cross‑origin window/frame (e.g., window.top.name or window.parent.name). On MiuiBrowser 14 (Android 14, Chrome 112 base), accessing properties on cross‑origin windows is stricter and throws (Firefox-like message).
This helped us understand a security boundary we were hitting when trying to get the name of the page in a iframe-d environment.
Or when it catches those React 18 hydration mismatches that make zero sense until the AI explains your server and client are rendering different timestamps. Classic vibe-coding mistake—copying an example without understanding why Date.now() breaks SSR.
I Hate That This Works So Well
Look, I wanted this to be a gimmick. Another AI bandwagon feature we’d quietly deprecate in six months. But watching it diagnose a memory leak in a customer’s infinite scroll implementation faster than I could even load the error report? That hurt my pride and saved my afternoon.
The AI Debugger solves a real problem. Modern JavaScript errors are increasingly complex. We’re dealing with framework-specific quirks that change every minor version, browser inconsistencies that would make a CSS developer weep, and race conditions in code that nobody—human or machine—really understands.
Having an AI code debugger that can instantly analyze all this context and provide actionable fixes like a senior web engineer is pretty useful. Especially when half your codebase was written by a large language model trained on StackOverflow questions from 2018.
Automatic Analysis
Every error in TrackJS now comes with AI-powered debugging insights. No buttons to click, no prompts to write. Just answers. It’s already there when you open the error report, like a senior developer who actually reads error messages.
Context-Aware Solutions
The AI Debugger sees everything TrackJS captures: stack traces, browser info, user actions, console logs, network requests. It’s working with the full picture, not just a snippet you copy-pasted into the chat.
Safe and Sanitized
Your error data is anonymized before analysis. No user information, no sensitive data, no training on your bugs. We see enough JavaScript disasters—we don’t need to collect them.
Actually Helpful Suggestions
No generic “have you tried turning it off and on again” advice. Real, specific, actionable fixes based on your actual error context.
Resistance Is Futile
We’ve entered the age of AI-assisted everything. AI writes our code, AI reviews our PRs, and now AI debugs our errors. I’m expecting AI to start attending our standups and explaining why the sprint is behind schedule.
The TrackJS AI Debugger isn’t fighting this reality—it’s embracing it. If you’re going to vibe-code your way through development, you might as well vibe-debug your way out of problems. At least this way, you might learn something about why your robot-written code exploded.
Try the Vibe Debugger Today
The AI Debugger is available now for all TrackJS accounts, including free trials. No configuration needed, obviously. We wouldn’t dare ask you to configure something in 2025. It just works, analyzing your errors and providing fixes faster than you can say “prompt engineering.”
Start your free trial and experience the future of debugging: where one AI fixes another AI’s mistakes while you grab coffee and contemplate whether you’re still technically a developer or just a prompt shepherd.


