Debugging JavaScript Errors
Refused to get unsafe header

We ran into a scary looking error message in the Chrome console, Refused to get unsafe header "TrackJS-Correlation-Id". Our code was trying to read this header from a request, so it looked like something real, except that other than the error message, everything was working fine. Let’s explore what was happening and how we fixed it.
Breaking down the Message
Refused to get unsafe header "HTTP_HEADER_NAME"
This message is shown in Chrome DevTools as part of an internal security control. It is not a JavaScript error, a “non-error”. That is, you can’t catch it, there is no object to inspect, and code execution is not stopped.
The message describes a failed attempt to access header data from a network request.
We discovered this error while working on a prototype of our browser error monitoring agent. It showed prominently red in the Chrome console, but no other browsers reported it. And the execution of our code was not affected.
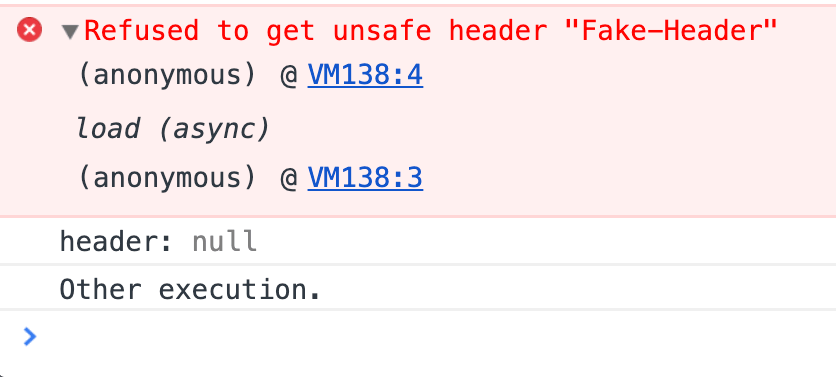
Even stranger, none of our monitoring could detect this error. It only appeared in the Chrome DevTools console. The error occurs with code like this:
var xhr = new XMLHttpRequest();
xhr.open("GET", "https://cdn.trackjs.com/agent/v3/latest/t.js");
xhr.addEventListener("load", function(data) {
  console.log("header:", xhr.getResponseHeader("Fake-Header"));
  console.log("Other execution.");
});
xhr.send();
This example fetches a file from the TrackJS CDN and attempts to read the Fake-Header header from the request, which obviously doesn’t exist. We can see the error in our console, printed from the call to xhr.getResponseHeader along with a stack trace. But we can also see that we received a null value from the call, and that the function continued to execute!
Understanding the Root Cause
This is non-standard behavior in the Chromium source code. It prints an “non-error” message into the console, but this is a browser-level error rather than a JavaScript one. It cannot be caught or logged, and no execution has been stopped.
Why the Chromium team decided to print this scary message any time a nullable value returned null is not clear.
How to Fix Workaround It
Despite this message being a “non-error”, you may still want to avoid it in your console to save yourself some stress and questions down the road.
1. Add Defensive Checking
xhr.getResponseHeader is unsafe to call unless you know the header is present and readable, which we can check with xhr.getAllResponseHeaders.
var xhr = new XMLHttpRequest();
xhr.open("GET", "https://cdn.trackjs.com/agent/v3/latest/t.js");
xhr.addEventListener("load", function(data) {
  if (xhr.getAllResponseHeaders().indexOf("Fake-Header") >= 0) {
    console.log("header:", xhr.getResponseHeader("Fake-Header"));
  }
  console.log("Other execution.");
});
xhr.send();
We check the complete string of headers to see if our header is present before asking for it. Thus, we avoid the scary Chrome “non-error”.
2. Monitor Your Environment
There are all kinds of errors on the web, many that will cause problems and prevent your site from working right. TrackJS can help you know when errors happen and how to fix them. Give it a try with our totally free trial and let us help you build a better website.


")
")