TODO: Error Handling in AngularJS
Welcome to the next installment of the TODO Error Handling series from TrackJS. We’ve looked at the TODOMVC.com example applications and wiring them up for better error handling with TrackJS. In other posts, we’ve covered:
AngularJS is a popular open-source JavaScript application framework, often used for single-page applications. Let’s figure out how AngularJS handles errors and what it let’s us do to debug them. We’ll be using the AngularJS TODO app from ToDoMVC.com as our example application.
AngularJS Error Handling
AngularJS provides a service called $exceptionHandler. It handles errors by capturing them and logging them to the console using the $log service, another AngularJS service that wraps up console.log() to make it safe to use if the console object doesn’t exist. Also, Angular tries to provide a cause along with the error to provide some additional context to what went wrong.
Here’s a look at the default implementation that receives the error from somewhere in your app and passes it through to the default delegate, which writes it to console log. We can change this to do other things, like hide the messages from the console in production and put them into storage instead:
angular.module("YOUR_APP", [])
  .config(["$provide", function ($provide) {

    $provide.decorator("$exceptionHandler", ["$delegate", "$window", "myConfig", function($delegate, $window, myConfig) {
      return function (exception, cause) {
        if(myConfig.environment === "production") {
          $window.sessionStorage.log = $window.sessionStorage.log || [];
          $window.sessionStorage.log.append({ exception: exception, cause: cause });
        }
        else {
          $delegate(exception, cause);
        }
      };
    }]);
  }]);
Integrating TrackJS
Extending the basic capabilities of AngularJS with TrackJS allows you to track and trend how your application breaks. Basic integration with AngularJS is as simple as copying the TrackJS snippet into your application. Simply signup for a TrackJS account and paste the script into your markup.
Basic Error Integration
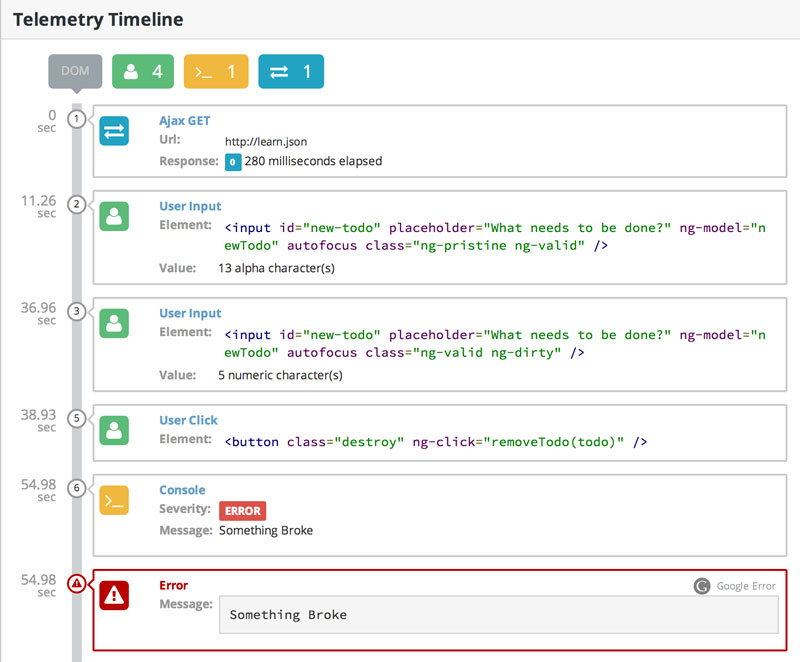
Let’s create an error to see what kind of data TrackJS captures for us out of the box. Start by simply using the App, create a few TODOs, edit one, and delete one. Once you feel good about your list, open the console and enter console.error("Something broke!");
Open TrackJS and you’ll see the error was captured along with tons of user interactions and data. For user inputs, we provide the user action, element markup snapshot, and a value interpretation. We never send input data to TrackJS, we instead parse the HTML and regex the values, then filter out the value info before we collect it. This is a secure way to give you insight to the type of input without exposing private data.
Customized Error Integration
You already get great coverage with a basic installation of TrackJS, but if you want access to private data and methods within the application we need a deeper integration. This snippet from the TrackJS docs shows how to easily plug TrackJS directly into the AngularJS $exceptionHandler.
angular.module("YOUR_APP", [])
  .config(["$provide", function ($provide) {

    $provide.decorator("$exceptionHandler", ["$delegate", "$window", function($delegate, $window) {
      return function (exception, cause) {
        if ($window.trackJs) {
          $window.trackJs.track(exception);
        }
        // (Optional) Pass the error through to the delegate
        $delegate(exception, cause);
      };
    }]);

  }]);
Now if an error occurs within the Angular application it will be caught and passed to TrackJS to be logged. Since TrackJS is within the scope of the application it’s easy to add additional information to the error logs. We can also pass the error object back to the $delegate(), an optional step that will ensure the error is visible in the console.
Example Errors
Let’s put it to the test by breaking our AngularJS application by causing an error. Open up todoCtrl.js. and add an undef(); function within the addTodo() method.
$scope.addTodo = function () {
var newTodo = $scope.newTodo.trim();
if (!newTodo.length) {
return;
}
// Oops, we broke it
undef();
todos.push({
title: newTodo,
completed: false
});
$scope.newTodo = "";
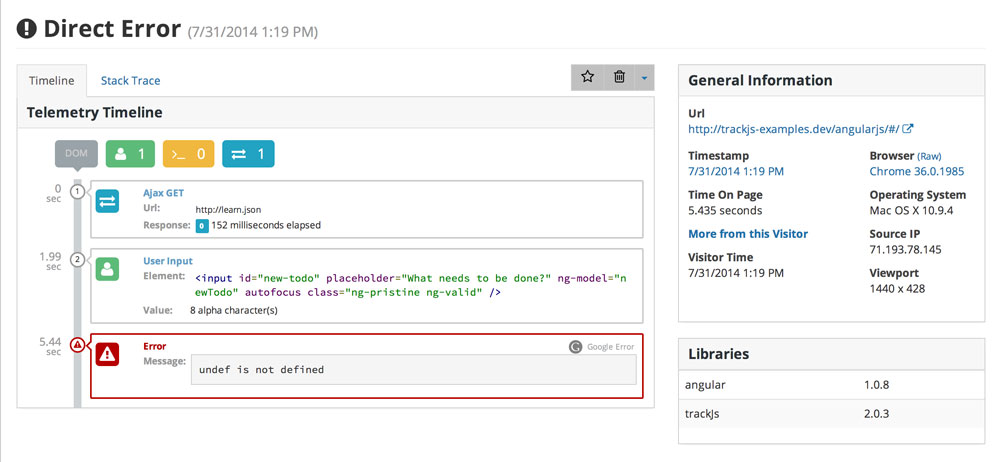
};Now refresh your browser, add a few todos and then try to remove one-todos cannot be removed, as expected, and an error is triggered. Open TrackJS and navigate to the new error, you’ll see that we’ve captured the stack trace as well as some additional context.
Application Specific Information
Getting an error message, stacktrace plus app telemetry adds so much more insight into your applications errors. With some simple TrackJS config options you can add application specific context for your own reference when reviewing application errors. You can easily add these parameters in the TrackJS config object on initialization.
TrackJS.install({
version: "VERSION_FROM_SERVER",
sessionId: "SESSIONID_FROM_SERVER",
userId: "USERID_FROM_SERVER",
application:"APP_SLUG_FROM_TRACKJS",
token: "YOUR_TOKEN_FROM_TRACKJS"
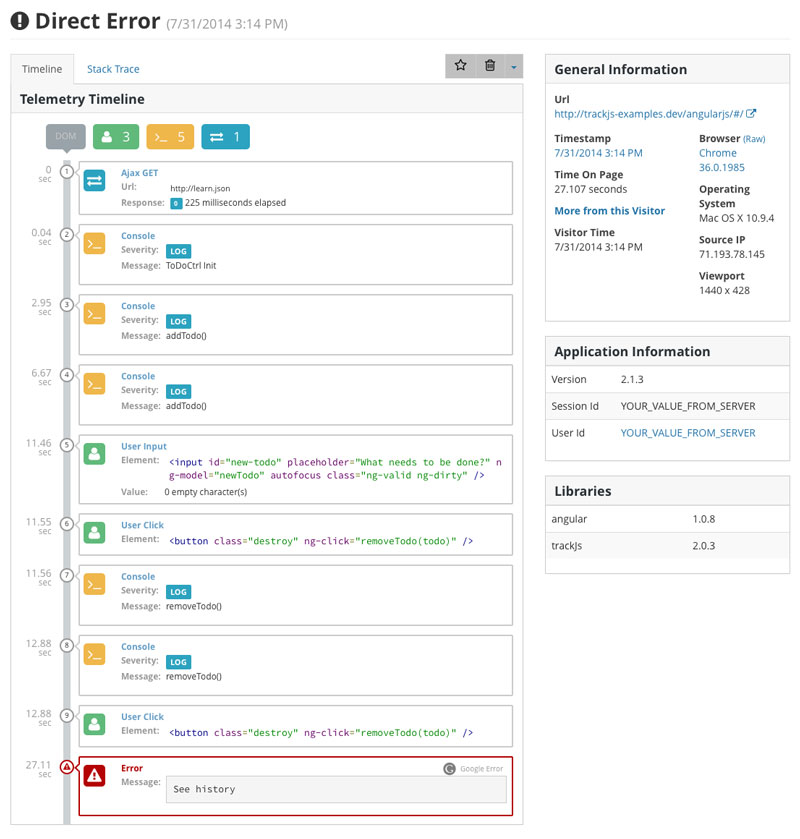
});If you cause the same undefined error you’ll see the additional data in the “Application Information” box. You can also filter errors by UserID directly from this box, or by navigating to the “Users” tab once you’ve logged UserIds. “Applications” adds the ability to segment all error data using a simple application slug in your config, simply add your app in the TrackJS Applications page and add the slug to your config.
Custom Logging
The Telemetry Timeline is super helpful for replicating errors and it can speak volumes when you add additional log info. For example, we can log applications events, initializations, timestamps, and more. This data will be captured in the timeline. We’ve added some console.log() calls during initializations and when specific methods fire–building your own black-box of events in case an error occurs. We’ve decorated the code with some logging statements to give a more thorough history of the TODOMVC behavior.
Custom Events
Want to track your own Telemetry events? At any time you want to capture the latest network, console, and user interactions simply call trackJs.track() method. In this case we simply want to see what was going on right before the user edits a todo. Simply add trackJs.track("custom event capture"); at the point you want to capture TrackJS history. This can be incredibly handy when trying to track down a UI or logic error that doesn’t actually cause an exception.
Another JavaScript framework protected by TrackJS. We hope you learned a bit about error handling in AngularJS and how easy it is to get started with error handling. If you haven’t already, grab a free 14-day trial and let us help you start finding and fixing bugs in your AngularJS applications!
